Stock Market Outlook for November 4, 2022

Cyclical sectors of the market are charting fresh 52-week relative highs as technology suffers.
*** Stocks highlighted are for information purposes only and should not be considered as advice to purchase or to sell mentioned securities. As always, the use of technical and fundamental analysis is encouraged in order to fine tune entry and exit points to average seasonal trends.
Stocks Entering Period of Seasonal Strength Today:
Subscribers – Click on the relevant link to view the full profile. Not a subscriber? Signup here.

Orthofix Medical Inc. (NASD:OFIX) Seasonal Chart

Virtu Financial, Inc. (NASD:VIRT) Seasonal Chart

Fabrinet (NYSE:FN) Seasonal Chart

CPB, Inc. (NYSE:CPF) Seasonal Chart

Rogers Sugar Inc. (TSE:RSI.TO) Seasonal Chart

Exchange Income Corp. (TSE:EIF.TO) Seasonal Chart

Plaza Retail REIT (TSE:PLZ/UN.TO) Seasonal Chart

Centene Corp. (NYSE:CNC) Seasonal Chart

Intertape Polymer Group, Inc. (TSE:ITP.TO) Seasonal Chart

Cardinal Health, Inc. (NYSE:CAH) Seasonal Chart

VanEck Vectors Pharmaceutical ETF (NASD:PPH) Seasonal Chart
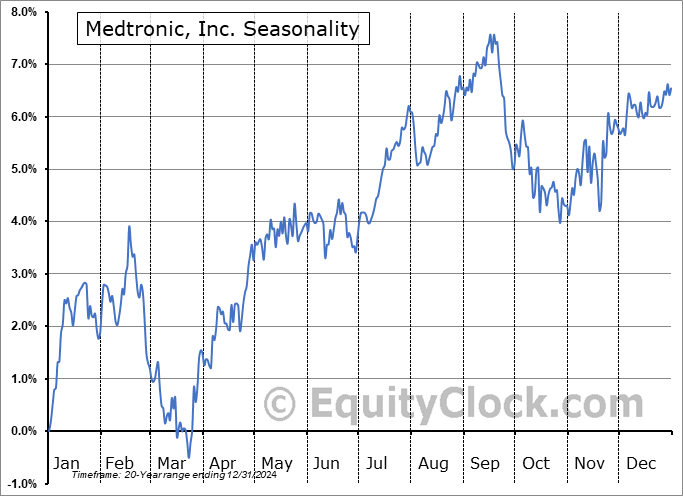
Medtronic, Inc. (NYSE:MDT) Seasonal Chart

BlackBerry (TSE:BB.TO) Seasonal Chart

Sonoco Products Co. (NYSE:SON) Seasonal Chart

Boston Properties, Inc. (NYSE:BXP) Seasonal Chart
The Markets
Stocks slipped further on Thursday as the spill-over of the negative reaction to the Fed Chair Jerome Powell’s post Fed meeting commentary continued. The S&P 500 Index fell by just over one percent, continuing to feel the drag from the technology sector as the rising cost of borrowing weighs. The benchmark closed around short-term support at its rising 20-day moving average, attempting to keep the short-term bottoming setup that the benchmark has shown in recent weeks intact. Momentum indicators are rolling over with MACD converging on its signal line in what is poised to amount to an imminent sell signal. The intermediate trend of lower-lows and lower-highs persists and the short-term rising trend stemming from the mid-October low has been violated. We are waiting to see where the dust settles and where we can once again ramp up risk exposure in the Super Simple Seasonal Portfolio to position ourselves appropriately for the positivity of the market that is typical of the end of the year. A weaker seasonal pattern through the the middle of November, on average, risks being exacerbated by tax loss selling, of which portfolio managers have plenty of positions to choose from. Typically, the tax loss selling/portfolio rebalancing pattern into year end has a mean reversion effect where winners are typically sold off/profits booked and funds are allocated back to the losers. Growth stocks in the consumer discretionary and technology sectors certainly dominate the losers list, while energy stocks have been the winners, both ripe for mean reversion and/or internal rebalancing through the remaining weeks of the year.

Today, in our Market Outlook to subscribers, we discuss the following:
- New 52-week relative lows for Technology and new 52-week relative highs for Energy, Industrials, Financials, and Health Care
- The breakout of the TSX 60 Index and the optimal holding period
- Weekly Jobless Claims and the health of the labor market
- A preview of what to expect for September’s payroll report
- Factory Orders for September and what it has to say about materials demand
Subscribers can look for this report in their inbox or by clicking on the following link and logging in: Market Outlook for November 4
Not signed up yet? Subscribe now to receive full access to all of the research and analysis that we publish.
Sentiment on Thursday, as gauged by the put-call ratio, ended bearish at 1.06.

Seasonal charts of companies reporting earnings today:


 Seasonal Chart")


 Seasonal Chart")


S&P 500 Index


TSE Composite


| Sponsored By... |

|


