Stock Market Outlook for November 1, 2022

Over the past two decades, the S&P 500 Index has averaged a gain of 1.8% in November with 75% of periods showing a positive result.
*** Stocks highlighted are for information purposes only and should not be considered as advice to purchase or to sell mentioned securities. As always, the use of technical and fundamental analysis is encouraged in order to fine tune entry and exit points to average seasonal trends.
Stocks Entering Period of Seasonal Strength Today:
Subscribers – Click on the relevant link to view the full profile. Not a subscriber? Signup here.

Ethan Allen Interiors Inc. (NYSE:ETD) Seasonal Chart

Vanguard Russell 3000 ETF (NASD:VTHR) Seasonal Chart

Vanguard Russell 1000 Value ETF (NASD:VONV) Seasonal Chart

Vanguard Industrials ETF (NYSE:VIS) Seasonal Chart
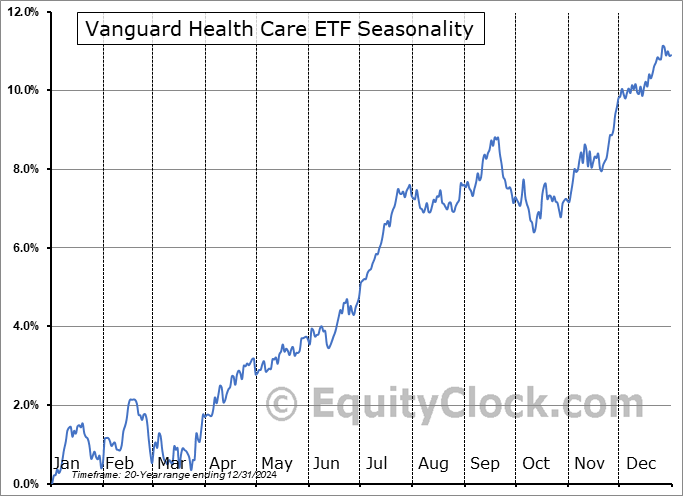
Vanguard Health Care ETF (NYSE:VHT) Seasonal Chart

ProShares UltraPro Russell2000 (NYSE:URTY) Seasonal Chart

Invesco S&P SmallCap Health Care ETF (NASD:PSCH) Seasonal Chart

Invesco DWA Financial Momentum ETF (NASD:PFI) Seasonal Chart

ArcelorMittal SA (NYSE:MT) Seasonal Chart
The Markets
Stocks closed mixed on the last session of October as investors take a breather following the tremendous rally over the past couple of weeks. The S&P 500 Index closed down by three-quarters of one percent, remaining above recently broken resistance at the 50-day moving average. The declining 100-day moving average at 3900 remains the test as resistance, while the rising 20-day moving average at 3728 remains in a position of support. Momentum indicators remain on the rise and are even inching into the upper half of their ranges, attempting to shake off the characteristics of a bearish trend that have dominated for much of the year. There remains questions pertaining to the intermediate path of stocks, but the short-term trend of lower-lows and lower-highs that stemmed from the intermediate peak in August is deemed to have been broken, which is conducive to continued strength between here are year-end. This is still a counter-trend rally and we must be prepared for any curveballs that may be thrown. Wednesday’s FOMC announcement is certainly notable on our radar.

Today, in our Market Outlook to subscribers, we discuss the following:
- Monthly look at the large-cap benchmark
- Seasonal tendencies for stocks during the month of November
- Ratings changes in this weeks chart books
- Stocks that have either gained or lost in every November during their trading history
Subscribers can look for this report in their inbox or by clicking on the following link and logging in: Market Outlook for November 1
Not signed up yet? Subscribe now to receive full access to all of the research and analysis that we publish.
Looking ahead, November tends to continue to the positivity in the market that originated in the month of October. Over the past two decades, the S&P 500 Index has gained 1.8% in this second to last month of the year with an impressive 75% of periods showing a positive result. We provide further insight of everything to look for in our recently released monthly outlook for November.


Want to know which areas of the market to buy or sell? Our Weekly Chart Books have just been updated, providing a clear Accumulate, Avoid, or Neutral rating for currencies, cryptocurrencies, commodities, broad markets, and subsectors/industries of the market. Subscribers can login and click on the relevant links to access.
Subscribe now.
Just released…
Our Monthly Outlook for November is out, providing you with everything to set you up for the month(s) ahead.
Highlights in this report include:
- Equity market tendencies in the month of November
- Fourth quarter performance for stocks following pronounced September declines
- First back-to-back monthly declines in Home Prices since January of 2019
- The Election Year Cycle for stocks
- Institutional managers underexposed to stocks into year-end, but will they take a bite?
- Concerns for retail ahead of the holiday season
- Shipping is slipping again
- Industrial production metrics holding up, but for how long
- Fed showing no success reining in inflationary pressures
- The correlation between wages and the effective Federal funds rate
- Out with rate sensitives and in with rate beneficiaries
- Job openings falling and layoffs jumping
- Wholesaler inventories still ballooning except for one segment of the economy
- Bonds
- US Dollar
- The rise of Bitcoin
- Breadth indicators rebounding from levels of significance
- Seasonal decline in volatility into the end of the year
- Time to shift focus to smaller cap stocks
- Positioning for the months ahead
- Sector Reviews and Ratings
- Stocks that have Frequently Gained in the Month of November
- Notable Stocks and ETFs Entering their Period of Strength in November
Subscribers can look for this report in their inbox or via the report archive at https://charts.equityclock.com/
Not subscribed yet? Signup now for only $25 per month and receive access to all of the research that we publish, including our daily/monthly reports, seasonal profiles, and our widely popular chart books, providing clear Accumulate or Avoid ratings of each segment of the market.
With the new month upon us and as we celebrate the release of our monthly report for November, today we release our screen of all of the stocks that have gained in every November over their trading history. While we at Equity Clock focus on a three-pronged approach (seasonal, technical, and fundamental analysis) to gain exposure to areas of the market that typically perform well over intermediate (2 to 6 months) timeframes, we know that stocks that have a 100% frequency of success for a particular month is generally of interest to those pursuing a seasonal investment strategy. Below are the results:

And how about those securities that have never gained in this eleventh month of the year, here they are:

*Note: None of the results highlighted above have the 20 years of data that we like to see in order to accurately gauge the annual recurring, seasonal influences impacting an investment, therefore the reliability of the results should be questioned. We present the above list as an example of how our downloadable spreadsheet available to yearly subscribers can be filtered.
Sentiment on Monday, as gauged by the put-call ratio, ended close to neutral at 0.94.

Seasonal charts of companies reporting earnings today:


 Seasonal Chart")


S&P 500 Index


TSE Composite


| Sponsored By... |

|


