Stock Market Outlook for October 28, 2022

Defense capital goods orders continue to keep industrial activity afloat, even as weakening consumer demand takes a toll on other segments of the manufacturing economy.
*** Stocks highlighted are for information purposes only and should not be considered as advice to purchase or to sell mentioned securities. As always, the use of technical and fundamental analysis is encouraged in order to fine tune entry and exit points to average seasonal trends.
Stocks Entering Period of Seasonal Strength Today:
Subscribers – Click on the relevant link to view the full profile. Not a subscriber? Signup here.

Vanguard Small-Cap Growth ETF (NYSE:VBK) Seasonal Chart

Oppenheimer Mid Cap Revenue ETF (NYSE:RWK) Seasonal Chart

Invesco S&P 500 Equal Weight Industrials ETF (NYSE:RGI) Seasonal Chart

Invesco S&P 500 Equal Weight Consumer Discretionary ETF (NYSE:RCD) Seasonal Chart

SPDR S&P Midcap 400 ETF (NYSE:MDY) Seasonal Chart

iShares Russell 2000 ETF (NYSE:IWM) Seasonal Chart

First Trust ISE Water Index Fund (NYSE:FIW) Seasonal Chart

AbbVie Inc. (NYSE:ABBV) Seasonal Chart

Invesco Dynamic Leisure and Entertainment ETF (NYSE:PEJ) Seasonal Chart

Mednax, Inc. (NYSE:MD) Seasonal Chart

Marvell Technology Inc (NASD:MRVL) Seasonal Chart
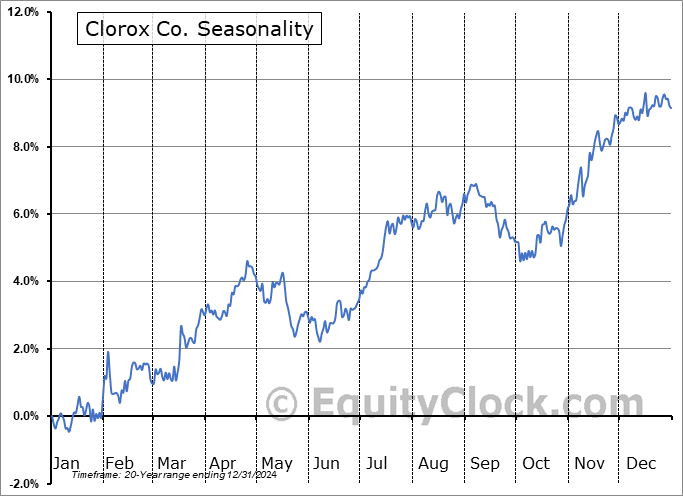
Clorox Co. (NYSE:CLX) Seasonal Chart
The Markets
Stocks closed mixed again on Thursday as a shocking decline in shares of Meta Platforms (META) following earnings sent a wave of selling back into growth sectors of the market. The S&P 500 Index closed down by around six-tenths of one percent, continuing to react to the declining 50-day moving average that now hovers around 3850. Support remains implied by the rising 20-day moving average around 3700. Momentum indicators continue to point higher, although early signs of rollover can start to be picked out as October’s momentum burst from the mid-month low fades. MACD is back to its middle line at 0 and a rollover from this midpoint would once again ingrain bearish characteristics that have been persistent all year. Seasonally, we have entered what has historically been the strongest time of the year for stocks running through the spring of next year, although the strength tends to be centered around the months of November and December, as well as March and April. There is still good reason to suspect that the market will stabilize during this first tranche of the best six months of the year for stocks, but the prospects for the start of the new year leave us fairly sceptical as the economy gravitates towards recession.

Today, in our Market Outlook to subscribers, we discuss the following:
- The performance of growth versus value stocks
- The alleviation of selling pressures in the bond market
- Moving up our stop on our core equity allocation in the Super Simple Seasonal Portfolio
- US Durable Goods Orders and the opportunities within
- Weekly Jobless Claims and the health of the labor market
Subscribers can look for this report in their inbox or by clicking on the following link and logging in: Market Outlook for October 28
Not signed up yet? Subscribe now to receive full access to all of the research and analysis that we publish.
Sentiment on Thursday, as gauged by the put-call ratio, ended bearish at 1.08.

Seasonal charts of companies reporting earnings today:


S&P 500 Index


TSE Composite


| Sponsored By... |

|


