Stock Market Outlook for October 13, 2022

Producer prices are curling back higher following a summer of declines, keeping inflationary pressures in the economy stubbornly intact.
*** Stocks highlighted are for information purposes only and should not be considered as advice to purchase or to sell mentioned securities. As always, the use of technical and fundamental analysis is encouraged in order to fine tune entry and exit points to average seasonal trends.
Stocks Entering Period of Seasonal Strength Today:
Subscribers – Click on the relevant link to view the full profile. Not a subscriber? Signup here.

TESSCO Technologies, Inc. (NASD:TESS) Seasonal Chart

PJT Partners Inc. (NYSE:PJT) Seasonal Chart

Stellantis N.V. (NYSE:STLA) Seasonal Chart

Vanguard Financials ETF (NYSE:VFH) Seasonal Chart

ProShares UltraPro MidCap400 (NYSE:UMDD) Seasonal Chart

ChemoCentryx, Inc. (NASD:CCXI) Seasonal Chart

James Hardie Industries NV (NYSE:JHX) Seasonal Chart

Bank of New York Mellon Corp (NYSE:BK) Seasonal Chart

Hawaiian Holdings, Inc. (NASD:HA) Seasonal Chart
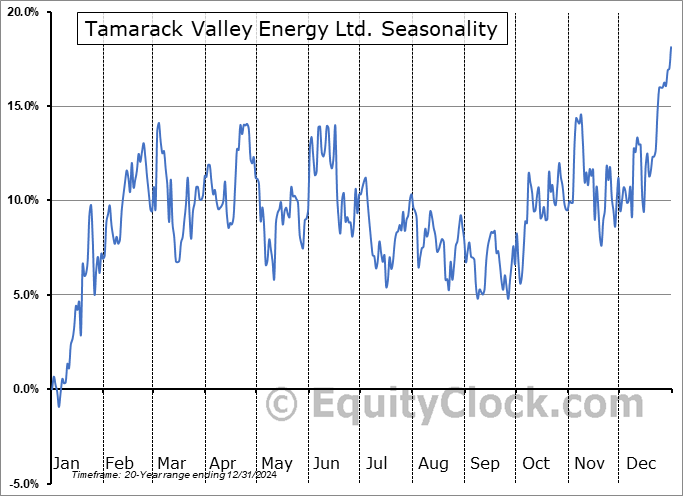
Tamarack Valley Energy Ltd. (TSE:TVE.TO) Seasonal Chart

Toromont Industries Ltd. (TSE:TIH.TO) Seasonal Chart

Snap On Inc. Holding Co. (NYSE:SNA) Seasonal Chart

3M Co. (NYSE:MMM) Seasonal Chart
The Markets
Stocks remained on edge ahead of the release of the pivotal Consumer Price Index report that is slated to be released on Thursday. The S&P 500 Index shed a third of one percent, continuing to sit below previous support around the June low. Major moving averages continue to point lower, providing hurdles to sell into in order to alleviate equity exposure in portfolios until such point that the trajectories shift. Momentum indicators are similarly showing characteristics of a bearish trend, giving little to be encouraged of the prevailing trend, yet. Below the June lows, the next major hurdles are the 50% retracement level of the entire pandemic rally at 3500, followed by the lower limit of the broadening declining range at 3400. Both are round numbers and hold psychological significance for investors to contemplate the value that has been derived by this year’s pullback. The latter level at 3400 also corresponds to the pre-pandemic high set in February of 2020, which, if hit, would bring the market full circle from the dramatic decline attributed to the pandemic recession followed by the significant rise attributed to the stimulus injection. While the trend of the market is still lower, something that is unlikely to change this year, we still view the probability of seeing strength through the end of the year as being more likely than not. Whether that means we chart that low this month or next we will leave open to debate.

Today, in our Market Outlook to subscribers, we discuss the following:
- US Producer Price Index
- Early signs of near-term upside exhaustion in yields and the dollar
- Rate sensitive sectors breaking down and rate beneficiaries see improving relative strength
Subscribers can look for this report in their inbox or by clicking on the following link and logging in: Market Outlook for October 13
Not signed up yet? Subscribe now to receive full access to all of the research and analysis that we publish.
Sentiment on Wednesday, as gauged by the put-call ratio, ended neutral at 1.00.

Seasonal charts of companies reporting earnings today:


 Seasonal Chart")


S&P 500 Index


TSE Composite


| Sponsored By... |

|


