Stock Market Outlook for October 5, 2022

Most threatening in the report on Job Openings and Labor Turnover (JOLTS) is the path of layoffs/discharges, which are rising at a rapid pace.
*** Stocks highlighted are for information purposes only and should not be considered as advice to purchase or to sell mentioned securities. As always, the use of technical and fundamental analysis is encouraged in order to fine tune entry and exit points to average seasonal trends.
Stocks Entering Period of Seasonal Strength Today:
Subscribers – Click on the relevant link to view the full profile. Not a subscriber? Signup here.

Onto Innovation Inc (NYSE:ONTO) Seasonal Chart
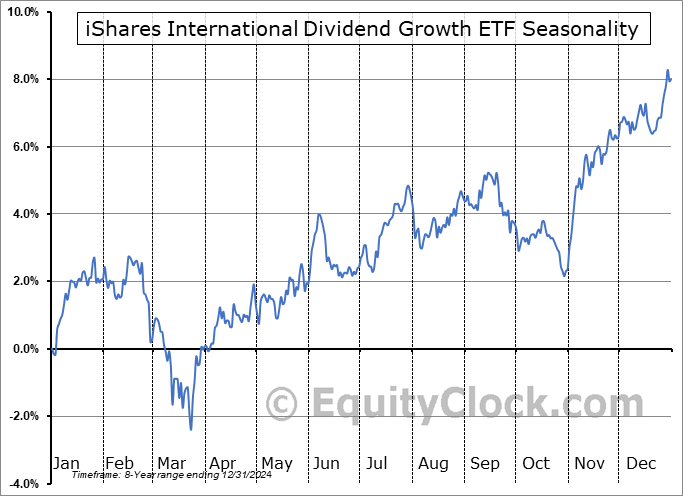
iShares International Dividend Growth ETF (AMEX:IGRO) Seasonal Chart

SPDR MSCI Emerging Markets Fuel Reserves Free ETF (AMEX:EEMX) Seasonal Chart

AdvisorShares Focused Equity ETF (AMEX:CWS) Seasonal Chart

VictoryShares International High Div Volatility Wtd ETF (NASD:CID) Seasonal Chart

Summit Financial Group Inc. (NASD:SMMF) Seasonal Chart

Cathedral Energy Services Ltd. (TSE:CET.TO) Seasonal Chart

CRA International, Inc. (NASD:CRAI) Seasonal Chart

Rocky Brands Inc. (NASD:RCKY) Seasonal Chart

Vecima Networks Inc. (TSE:VCM.TO) Seasonal Chart

Nova Measuring Instruments Ltd. (NASD:NVMI) Seasonal Chart

Ionis Pharmaceuticals, Inc. (NASD:IONS) Seasonal Chart
The Markets
Stocks surged for a second day as the US Dollar continues to pullback and the trend of yields alleviates. The S&P 500 Index closed with a gain of just over 3% to continue its snapback from levels below the June lows that were violated last week. The first level of resistance is directly overhead presented by the declining 20-day moving average at 3826 with the more ominous threat presented around the declining 50-day moving average at 4002. Momentum indicators are rebounding from deeply oversold territory, however, characteristics of a bearish trend, akin to what was observed through the first half of the year, has become re-ingrained. For the time being, using declining moving averages as hurdles to lighten up on equity exposure remains the prudent course of action, but we remain on the lookout for evidence of a shift of the intermediate-term trend that would bring our forecasted back half of the year rebound from the first half slump into fruition. An upside gap charted on Tuesday at 3700 provides a near-term hurdle to shoot off of on the long side, but, unfortunately, there remains questions pertaining to the intermediate-term trend given the downward slope of the 50-day moving average.

Today, in our Market Outlook to subscribers, we discuss the following:
- The hesitation of bond yields to move above their declining 20-day moving averages
- Job Openings and Labor Turnover Survey (JOLTS)
- US Factory Orders and the themes that are persistent in the report along with the investment implications that are warranted
- The breakout of the one commodity that has maintained an Accumulate rating in our chart books for the past few weeks
- Investor sentiment
Subscribers can look for this report in their inbox or by clicking on the following link and logging in: Market Outlook for October 5
Not signed up yet? Subscribe now to receive full access to all of the research and analysis that we publish.
Sentiment on Tuesday, as gauged by the put-call ratio, ended neutral at 0.98.

Seasonal charts of companies reporting earnings today:


S&P 500 Index


TSE Composite


| Sponsored By... |

|


