Stock Market Outlook for September 27, 2022

The S&P 500 Index is approaching its 200-week moving average, a level that has been the dividing line between simple corrections and recessionary declines.
*** Stocks highlighted are for information purposes only and should not be considered as advice to purchase or to sell mentioned securities. As always, the use of technical and fundamental analysis is encouraged in order to fine tune entry and exit points to average seasonal trends.
Stocks Entering Period of Seasonal Strength Today:
Subscribers – Click on the relevant link to view the full profile. Not a subscriber? Signup here.

Silvercrest Asset Management Group Inc. (NASD:SAMG) Seasonal Chart

Invesco S&P 500 Equal Weight Materials ETF (NYSE:RTM) Seasonal Chart

Deutsche X-trackers Harvest CSI 300 China A-Shares ETF (AMEX:ASHR) Seasonal Chart

United Airlines Holdings Inc. (NASD:UAL) Seasonal Chart
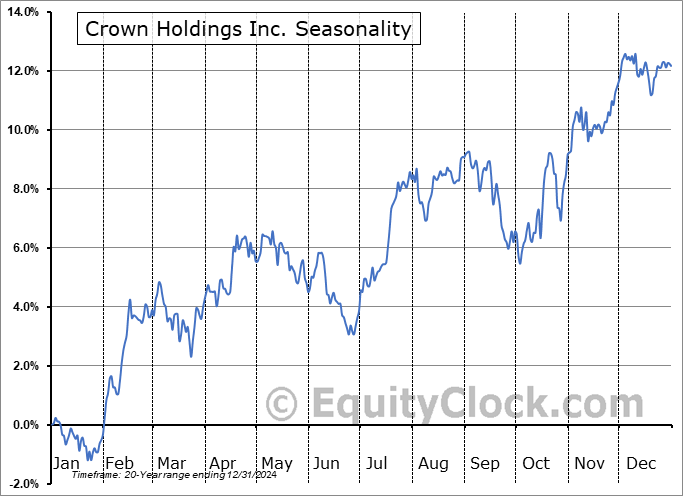
Crown Holdings Inc. (NYSE:CCK) Seasonal Chart

Stantec Inc (NYSE:STN) Seasonal Chart

Tredegar Corp. (NYSE:TG) Seasonal Chart
The Markets
The massive re-pricing in the market continues following the Fed’s shock that revealed it forecasts its key lending rate to be 4.4% by the end of the year, a full percentage point higher than previous guidance. The S&P 500 Index fell by just over one percent, testing the lows of the previous session and, more importantly, testing the lows charted in June. Momentum indicators are firmly embedded in oversold territory, but there is no evidence, yet, that they are set to turn higher as part of an oversold rebound. Major moving averages are all pointed lower, including the 50-day moving average, which has turned a corner following its summer rally. The 50-day moving average is viewed as a level to sell into in order to alleviate risk in portfolios, so long as the technicals continue evolve negatively and dollar/yield headwinds persist. While we are taking the market action day-by-day, one possible path for the broad market benchmark from here is a rebound from levels around the June lows as we transition out of this period of peak seasonal volatility at the end of September. Resistance at the aforementioned intermediate hurdle at the 50-day moving average would likely cap this rebound attempt before leading to a subsequent test of the summer lows shortly thereafter. With the break of the 38.2% Fibonacci Retracement level of the entire pandemic rally last week, we are looking at a scenario of lower-for-longer, therefore, do not expect a substantial V-shaped rebound in the market, such as what was realized following the selloff in 2020. We still want to be on the lookout for strength at some point in the last three months of the year, however.

Today, in our Market Outlook to subscribers, we discuss the following:
- The ongoing burden on stocks from yields and the dollar
- The significance of the 200-week moving average on the S&P 500 Index
- Notable ratings changes in this week’s chart books
- The start of the optimal holding period for semiconductor stocks
Subscribers can look for this report in their inbox or by clicking on the following link and logging in: Market Outlook for September 27
Not signed up yet? Subscribe now to receive full access to all of the research and analysis that we publish.
Want to know which areas of the market to buy or sell? Our Weekly Chart Books have just been updated, providing a clear Accumulate, Avoid, or Neutral rating for currencies, cryptocurrencies, commodities, broad markets, and subsectors/industries of the market. Subscribers can login and click on the relevant links to access.
Subscribe now.
Sentiment on Monday, as gauged by the put-call ratio, ended neutral at 0.96.

Seasonal charts of companies reporting earnings today:


S&P 500 Index


TSE Composite


| Sponsored By... |

|


