Stock Market Outlook for September 15, 2022

Forget energy and focus on this energy alternative trade that is breaking out to fresh all-time highs within its optimal holding period.
*** Stocks highlighted are for information purposes only and should not be considered as advice to purchase or to sell mentioned securities. As always, the use of technical and fundamental analysis is encouraged in order to fine tune entry and exit points to average seasonal trends.
Stocks Entering Period of Seasonal Strength Today:
Subscribers – Click on the relevant link to view the full profile. Not a subscriber? Signup here.

Employers Holdings Inc. (NYSE:EIG) Seasonal Chart

Enterprise Financial Services Corp. (NASD:EFSC) Seasonal Chart

Orange (NYSE:ORAN) Seasonal Chart

Value Line, Inc. (NASD:VALU) Seasonal Chart

CT Real Estate Investment Trust (TSE:CRT/UN.TO) Seasonal Chart
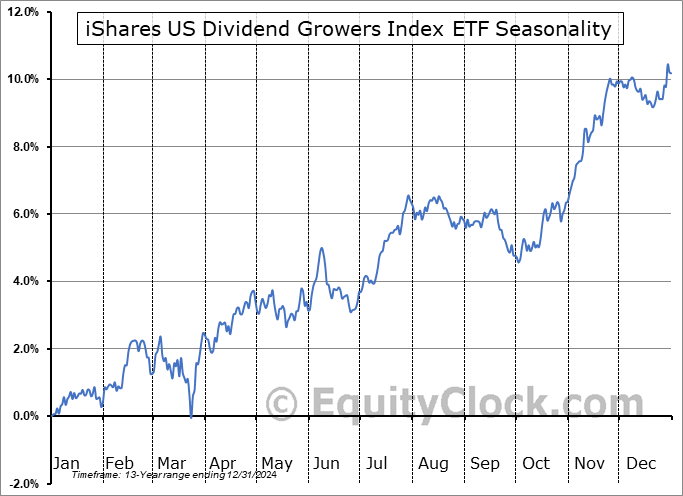
iShares US Dividend Growers Index ETF (CAD-Hedged) (TSE:CUD.TO) Seasonal Chart

Invesco S&P SmallCap Utilities ETF (NASD:PSCU) Seasonal Chart

Invesco S&P MidCap Low Volatility ETF (AMEX:XMLV) Seasonal Chart
The Markets
Stocks closed mildly higher following Tuesday’s mass panic that was fuelled by a hotter than expected read of inflationary pressures in the economy. The S&P 500 Index closed higher by a third of one percent after testing levels around horizontal support at 3900. Resistance remains firm at Tuesday downside gap around its 50-day moving average, which, for the time being, remains on the rise. Momentum indicators have turned back lower after rebounding back to levels around their middle lines in recent days. We remain on the lookout for the confirmation of a higher significant intermediate low that would form the basis to suggest a shift of trend in the market, but, following Tuesday’s downturn, we are likely going to have to wait for traders nerves to settle before some level-headedness returns to the market. Seasonally, we remain in the most volatile time of the year for stocks, a period that realizes erratic trading through the end of the third quarter.

Today, in our Market Outlook to subscribers, we discuss the following:
- US Petroleum Status and the state of demand
- The Energy Sector
- US Producer Price Index
- Canada Manufacturing Sales
- Lithium stocks
Subscribers can look for this report in their inbox or by clicking on the following link and logging in: Market Outlook for September 15
Not signed up yet? Subscribe now to receive full access to all of the research and analysis that we publish.
Sentiment on Wednesday, as gauged by the put-call ratio, ended bearish, again, at 1.09.

Seasonal charts of companies reporting earnings today:

S&P 500 Index


TSE Composite


| Sponsored By... |

|


