Stock Market Outlook for September 7, 2022

While economic data points to a recession on the horizon, credit balances in margin accounts hint that investors may not be positioned for the ultimate market downturn as they were prior to past recessions.
*** Stocks highlighted are for information purposes only and should not be considered as advice to purchase or to sell mentioned securities. As always, the use of technical and fundamental analysis is encouraged in order to fine tune entry and exit points to average seasonal trends.
Stocks Entering Period of Seasonal Strength Today:
Subscribers – Click on the relevant link to view the full profile. Not a subscriber? Signup here.

First Northwest Bancorp (NASD:FNWB) Seasonal Chart
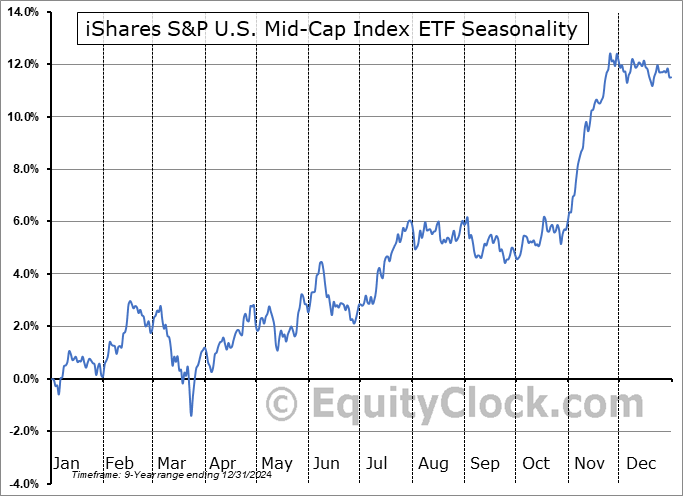
iShares S&P U.S. Mid-Cap Index ETF (TSE:XMC.TO) Seasonal Chart

Cambria Shareholder Yield ETF (AMEX:SYLD) Seasonal Chart

SPDR S&P 500 Value ETF (NYSE:SPYV) Seasonal Chart

Schwab US Dividend Equity ETF (AMEX:SCHD) Seasonal Chart

Invesco KBW Property & Casualty Insurance ETF (NASD:KBWP) Seasonal Chart
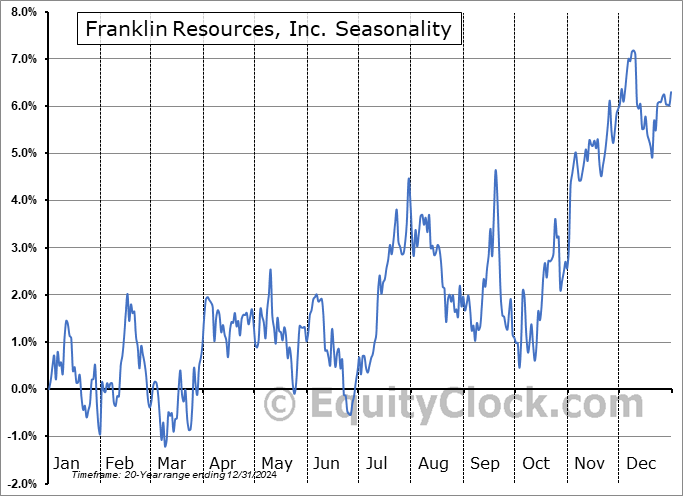
Franklin Resources, Inc. (NYSE:BEN) Seasonal Chart

Renaissance RE Holdings Ltd. (NYSE:RNR) Seasonal Chart

Chubb Ltd. (NYSE:CB) Seasonal Chart
The Markets
Stocks closed in the red on Tuesday as traders returned to their desks following the long weekend to take down risk in their portfolio amidst a jump in the cost of borrowing. The S&P 500 Index closed lower by four-tenths of one percent, maintaining levels below its 50-day moving average that was broken in the past week. Momentum indicators remain in decline, but, in a point of encouragement, the negative expansion of the MACD histogram has stopped, hinting that traders may be becoming more comfortable with prices where they have fallen to. The Relative Strength Index is testing rising trendline support that underlines the lows of the year, hinting of the fading of selling pressures after a tough first half of the year. Following the significantly overbought reading according to this metric at the peak of the summer rally in August, it would be rare to see these metrics of momentum immediately revert back to their bearish characteristics seen earlier in the year. We still desire to see the turn before putting capital at risk and are more than content sitting with our conservative positioning in the Super Simple Seasonal Portfolio, which continues to strongly outperform the market.

Want to know which areas of the market to buy or sell? Our Weekly Chart Books have just been updated, providing a clear Accumulate, Avoid, or Neutral rating for currencies, cryptocurrencies, commodities, broad markets, and subsectors/industries of the market. Subscribers can login and click on the relevant links to access.
Subscribe now.
Today, in our Market Outlook to subscribers, we discuss the following:
- Hourly look at the large-cap benchmark
- Notable ratings changes in this week’s chart books
- Copper
- Credit balances in margin accounts
Subscribers can look for this report in their inbox or by clicking on the following link and logging in: Market Outlook for September 7
Not signed up yet? Subscribe now to receive full access to all of the research and analysis that we publish.
Sentiment on Tuesday, as gauged by the put-call ratio, ended bearish at 1.14.

Seasonal charts of companies reporting earnings today:


S&P 500 Index


TSE Composite


| Sponsored By... |

|


