Stock Market Outlook for September 6, 2022

Stocks fall despite a goldilocks employment report.
*** Stocks highlighted are for information purposes only and should not be considered as advice to purchase or to sell mentioned securities. As always, the use of technical and fundamental analysis is encouraged in order to fine tune entry and exit points to average seasonal trends.
Stocks Entering Period of Seasonal Strength Today:
Subscribers – Click on the relevant link to view the full profile. Not a subscriber? Signup here.

Becton Dickinson and Co. (NYSE:BDX) Seasonal Chart

Ametek, Inc. (NYSE:AME) Seasonal Chart

Umpqua Holdings Corp. (NASD:UMPQ) Seasonal Chart

General Motors Co. (NYSE:GM) Seasonal Chart

Amphenol Corp. (NYSE:APH) Seasonal Chart

Agilent Technologies, Inc. (NYSE:A) Seasonal Chart

IntercontinentalExchange Group, Inc. (NYSE:ICE) Seasonal Chart

SPDR SSGA US Small Cap Low Volatility Index ETF (AMEX:SMLV) Seasonal Chart

Advance Auto Parts Inc. (NYSE:AAP) Seasonal Chart

iShares MSCI World Index ETF (TSE:XWD.TO) Seasonal Chart

BMO India Equity Index ETF (TSE:ZID.TO) Seasonal Chart
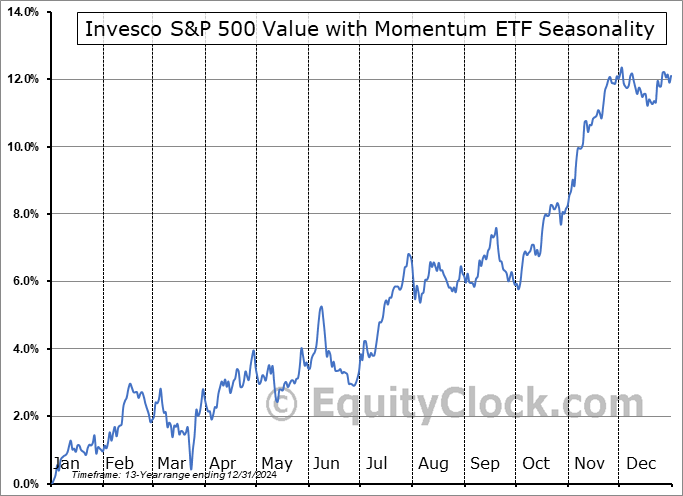
Invesco S&P 500 Value with Momentum ETF (AMEX:SPVM) Seasonal Chart
The Markets
Stocks dipped on Friday despite a rather goldilocks non-farm payroll report for August that was neither too hot nor too cold. The S&P 500 Index ended down by 1.07%, maintaining levels below its 50-day moving average. A reversal of the gains around the intermediate moving average at the high of the session instantly defines this hurdle as a level of resistance and it threatens to curl the slope of this pivotal point lower again. The 50-day moving average is highly indicative of the path of the intermediate-term trend, something that is important in our seasonal process. Momentum indicators are still pointed lower following the decline from overbought territory recorded just weeks ago, but the apparent lack of negative expansion of the MACD histogram following Friday’s equity downfall is hinting that we may be closer to the end of this latest wave lower in price. We remain on the lookout for a higher intermediate low in the market above the June bottomed to provide clear evidence that the trend has shifted positive for a sustainable multi-month move. We could be getting close, but still best to err on the side of caution until the turn is, in fact, realized. We are anxious to put our cash hoard to work, but during this traditionally volatile month and amidst the recent retracement of the summer rally and ongoing degradation of the economic fundamentals, there is no need to stick our necks out and gamble with the funds that we have sheltered thus far.

Today, in our Market Outlook to subscribers, we discuss the following:
- Weekly look at the large-cap benchmark
- US Employment Situation
- US Factory Orders
Subscribers can look for this report in their inbox or by clicking on the following link and logging in: Market Outlook for September 6
Not signed up yet? Subscribe now to receive full access to all of the research and analysis that we publish.
Sentiment on Friday, as gauged by the put-call ratio, ended bearish at 1.13.

Seasonal charts of companies reporting earnings today:


S&P 500 Index


TSE Composite


| Sponsored By... |

|


