Stock Market Outlook for August 23, 2022

After today’s session, you may need a drink and this industry that we just upgraded will cater to your need.
*** Stocks highlighted are for information purposes only and should not be considered as advice to purchase or to sell mentioned securities. As always, the use of technical and fundamental analysis is encouraged in order to fine tune entry and exit points to average seasonal trends.
Stocks Entering Period of Seasonal Strength Today:
Subscribers – Click on the relevant link to view the full profile. Not a subscriber? Signup here.
Toro Co. (NYSE:TTC) Seasonal Chart
Webster Financial Corp. (NYSE:WBS) Seasonal Chart
Sanmina Corp. (NASD:SANM) Seasonal Chart
First Community Bancshares Inc. (NASD:FCBC) Seasonal Chart
American Airlines Group Inc. (NASD:AAL) Seasonal Chart
Invesco S&P SmallCap Materials ETF (NASD:PSCM) Seasonal Chart
The Markets
Stocks fell on Monday as the rollover of major market benchmarks from levels around declining 200-day moving averages continues. The S&P 500 Index shed 2.14%, breaking below previous horizontal support/resistance at 4170, along with its rising 20-day moving average around the same hurdle. Momentum indicators are increasingly triggering sell signals with MACD crossing below its signal line on Monday, joining the sell signal that was triggered last week with respect to the Relative Strength Index (RSI). Sell signals across the board and and rejection/failure around major moving averages suggest that the correction/pullback in the market following the early summer rally is well underway. We continue to look towards the 50-day moving average (~3969) as a logical zone of intermediate support, one that, if confirmed, would derive a higher intermediate low above the June bottom, thereby definitively shifting the trend of the market to that of higher-highs and higher-lows.
Today, in our Market Outlook to subscribers, we discuss the following:
- Hourly look at the large-cap benchmark
- Resumption of the rising trend of the US Dollar
- Notable upgrades and downgrades in this week’s chart books: Find our what we have upgraded to Accumulate this week
Subscribers can look for this report in their inbox or by clicking on the following link and logging in: Market Outlook for August 23
Not signed up yet? Subscribe now to receive full access to all of the research and analysis that we publish.
Want to know which areas of the market to buy or sell? Our Weekly Chart Books have just been updated, providing a clear Accumulate, Avoid, or Neutral rating for currencies, cryptocurrencies, commodities, broad markets, and subsectors/industries of the market. Subscribers can login and click on the relevant links to access.
Subscribe now.
Sentiment on Monday, as gauged by the put-call ratio, ended bearish at 1.15.
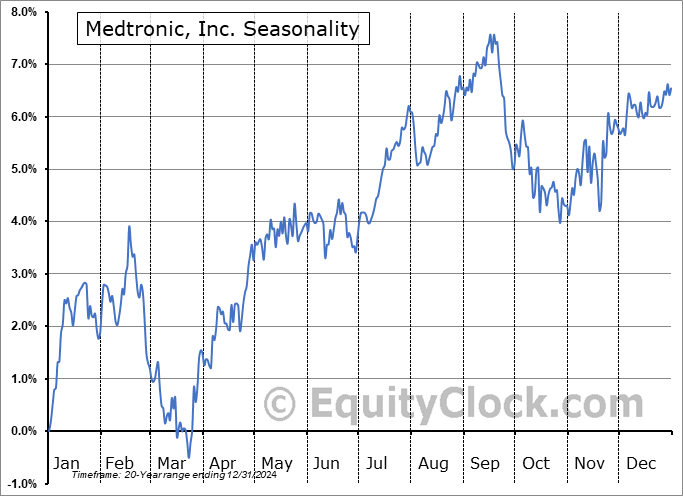
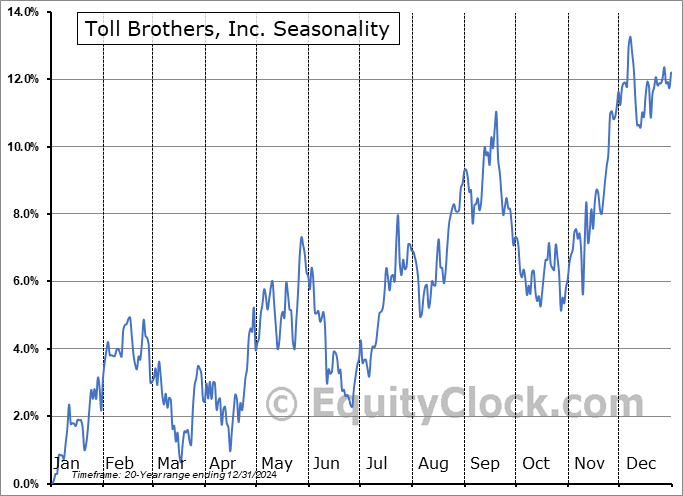
Seasonal charts of companies reporting earnings today:
S&P 500 Index
TSE Composite
| Sponsored By... |

|


