Stock Market Outlook for August 17, 2022

The average factory shutdown period in July was much tamer than average, but our concern for the manufacturing economy may be more appropriately placed with data to be released in the months ahead.
*** Stocks highlighted are for information purposes only and should not be considered as advice to purchase or to sell mentioned securities. As always, the use of technical and fundamental analysis is encouraged in order to fine tune entry and exit points to average seasonal trends.
Stocks Entering Period of Seasonal Strength Today:
Subscribers – Click on the relevant link to view the full profile. Not a subscriber? Signup here.

Invesco Ltd. (NYSE:IVZ) Seasonal Chart
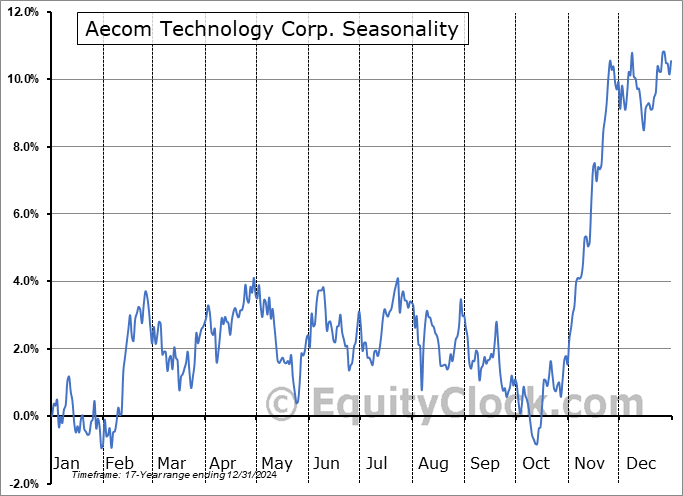
Aecom Technology Corp. (NYSE:ACM) Seasonal Chart

Nexstar Media Group, Inc. (NASD:NXST) Seasonal Chart

iShares MSCI Emerging Markets Index ETF (TSE:XEM.TO) Seasonal Chart

Global X Lithium ETF (NYSE:LIT) Seasonal Chart

Penns Woods Bancorp, Inc. (NASD:PWOD) Seasonal Chart
The Markets
Stocks managed to close in the green after wavering intraday following a test of significant resistance on the S&P 500 Index at the 200-day moving average. The large-cap benchmark closed higher by two-tenths of one percent, reaching within one point of its long-term average at 4326, providing a formidable hurdle that the benchmark is likely to show reaction to in the days/weeks ahead. The variable hurdle also aligns with declining trendline resistance that is derived by connecting the highs of January and March. Momentum indicators remain overbought with the Relative Strength Index (RSI) firmly above 70 and MACD at the highest level on record. While a new positive intermediate-term trend is still deemed to have started, coinciding with our back half of the year strength forecast for stocks, there is enough evidence to suggest that the market has come too far, too fast. A check-back/digestion looks necessary in order to solidify the onset of the intermediate rising trajectory that could still carry the market higher through year-end. The now rising 50-day moving average at 3959 looks to be the ideal zone to seek to add further risk to portfolios. Should the reaction to levels of resistance overhead prove to be severe, pulling back on equity exposure over the short-term and/or looking to reinitiate negative bets may be prudent, but we will wait to let the market tell us how aggressive the potential pullback will be.

Today, in our Market Outlook to subscribers, we discuss the following:
- The lack of indication that the recent strength in the equity market is sustainable
- US Industrial Production
- US Housing Starts
- Canada Consumer Price Index (CPI)
Subscribers can look for this report in their inbox or by clicking on the following link and logging in: Market Outlook for August 17
Not signed up yet? Subscribe now to receive full access to all of the research and analysis that we publish.
Sentiment on Tuesday, as gauged by the put-call ratio, ended bullish at 0.85.

Seasonal charts of companies reporting earnings today:


 Seasonal Chart")


 Inc. Seasonal Chart")


S&P 500 Index


TSE Composite


| Sponsored By... |

|


