Stock Market Outlook for August 2, 2022

The market is realizing a sentiment reset following the bearish bias that had become the norm through the first half of the year.
*** Stocks highlighted are for information purposes only and should not be considered as advice to purchase or to sell mentioned securities. As always, the use of technical and fundamental analysis is encouraged in order to fine tune entry and exit points to average seasonal trends.
Stocks Entering Period of Seasonal Strength Today:
Subscribers – Click on the relevant link to view the full profile. Not a subscriber? Signup here.
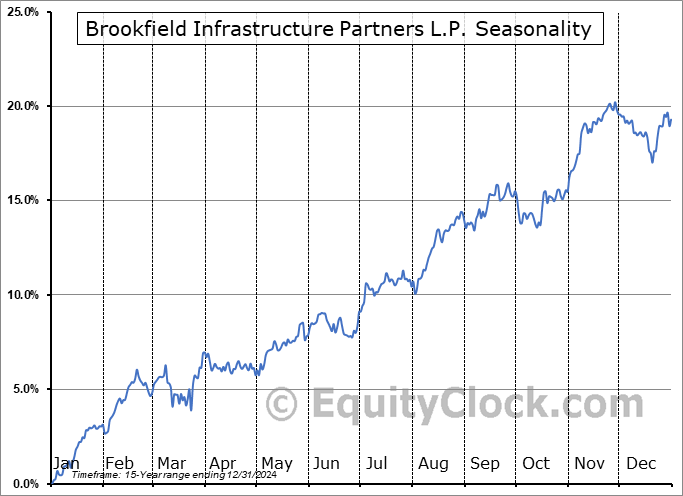
Brookfield Infrastructure Partners L.P. (TSE:BIP/UN.TO) Seasonal Chart

Signet Jewelers Ltd. (NYSE:SIG) Seasonal Chart

Polo Ralph Lauren Corp. (NYSE:RL) Seasonal Chart

Douglas Dynamics Inc. (NYSE:PLOW) Seasonal Chart

BMO Canadian Dividend ETF (TSE:ZDV.TO) Seasonal Chart

Africa Oil Corp. (TSE:AOI.TO) Seasonal Chart

Cass Commercial Corp. (NASD:CASS) Seasonal Chart
**Note: Due to the Civic Holiday in Canada on Monday (August 1st), our next report will be released on Tuesday**
The Markets
Stocks surged on Friday as investors embraced earnings from Tech titan Apple. The S&P 500 Index closed higher by 1.42%, quickly closing in on horizontal resistance presented by the May high around 4170. Support remains well defined at the 50-day moving average at 3922, a level that is now over 5% below present levels. A short-term stretched condition is becoming implied and we are encroaching on the hurdle that we were looking for a pause/digestion of the recent gains, still as part of a broader bottoming pattern. Momentum indicators are increasingly relinquishing the characteristics of a bearish trend that has plagued the market this year, moving above their middle lines and to the highest levels since November of last year. The backdrop suggests that the intermediate-trend of lower-lows and lower-highs that has been apparent this year is being threatened as investors gravitate back toward those segments of the market that led us lower through the first half.

Today, in our Market Outlook to subscribers, we discuss the following:
- Weekly look at the large-cap benchmark and the view for stocks ahead
- Margin debt in investor accounts
- Stocks that have gained or lost in every August over their trading history
- Canada GDP and what the results say about how to position in the equity market
- Investor Sentiment
Subscribers can look for this report in their inbox or by clicking on the following link and logging in: Market Outlook for August 2
Not signed up yet? Subscribe now to receive full access to all of the research and analysis that we publish.
Just released…
Our monthly report for August is out, providing subscribers with everything they need to know for the month(s) ahead.
Highlights in this report include:
- Equity market tendencies in the month of August
- Favor bonds or stocks?
- Average peak to inflationary pressures in the year
- Inflation expectations already in decline
- The shift back towards growth/technology
- Classic leading indication of an economic recession is triggering again
- Trend of high-yield spreads still expressing caution
- Increasing supply-demand mismatch in the housing market threatens to take down prices
- Weakness in some of the most discretionary categories of consumer spending raising concerns as to the health of the consumer
- Waning consumer momentum causing manufacturers to pullback
- Poor manufacturer sentiment
- Transportation metrics remaining some of the most threatening indications that the economy is on the path towards recession
- The end of the Great Resignation
- The trend of COVID cases in the US and the risk later this year
- Moving beyond the weakest first half of the year for stocks since 1970
- Downbeat investor sentiment conducive to a back-half of the year rebound
- Safe-haven sectors showing signs of struggle
- Looking for signs of a shift of trend of those segments of the market that led us lower
- The headwind of the rising US Dollar
- Natural Gas
- Positioning for the months ahead
- Sector Reviews and Ratings
- Stocks that have Frequently Gained in the Month of August
- Notable Stocks and ETFs Entering their Period of Strength in August
Subscribers can look for this report in their inbox or via the report archive at the following link: https://charts.equityclock.com/
Not subscribed yet? Signup now to receive full access to all of the content that we publish, including daily, intraday, and monthly reports, our weekly chart books, and thousands of seasonal profiles highlighting our proprietary optimal holding periods for all actively traded exchange listed investments in North America.
Sentiment on Friday, as gauged by the put-call ratio, ended neutral at 0.99.

Upcoming event
Using Seasonality to Determine Where We Are in the Economic Cycle (Recession)? and How to Invest
Saturday, September 17, 2022 | 3:00 pm – 3:45 pm EDT
Some leading indicators are hinting that we are on the path towards an economic recession, traditionally an ideal time to abandon risk in portfolios. Jon Vialoux will show you what he’s looking at and how to best position your portfolio using seasonal analysis.
Click on the following registration link to book your FREE spot to our presentation: Register Now

Seasonal charts of companies reporting earnings today:

 Seasonal Chart")


 Seasonal Chart")


S&P 500 Index


TSE Composite


| Sponsored By... |

|


