Stock Market Outlook for July 26, 2022

Stocks finally starting to show a footing as levels of resistance start to crack, but questions remain as to whether it is sufficient to fuel a sustainable rally beyond just a few days.
*** Stocks highlighted are for information purposes only and should not be considered as advice to purchase or to sell mentioned securities. As always, the use of technical and fundamental analysis is encouraged in order to fine tune entry and exit points to average seasonal trends.
Stocks Entering Period of Seasonal Strength Today:
Subscribers – Click on the relevant link to view the full profile. Not a subscriber? Signup here.
SPDR Barclays International Treasury Bond ETF (NYSE:BWX) Seasonal Chart
Nuveen Preferred and Income Term Fund (NYSE:JPI) Seasonal Chart
iShares iBoxx $ High Yield Corporate Bond ETF (NYSE:HYG) Seasonal Chart
Tetra Tech Inc. (NASD:TTEK) Seasonal Chart
iShares Core S&P/TSX Composite High Dividend Index ETF (TSE:XEI.TO) Seasonal Chart
iShares Canadian Financial Monthly Income ETF (TSE:FIE.TO) Seasonal Chart
Hillenbrand Inc. (NYSE:HI) Seasonal Chart
The Markets
Stocks closed mixed on Monday as investors brace for the onslaught of earnings reports through the week ahead. The S&P 500 Index closed higher by just over a tenth of one percent, continuing to hold above the 50-day moving average that was broken during last week’s rally. Declining trendline resistance and the upper limit to a declining wedge pattern remains violated as the market attempts to move beyond the intermediate-term trend of lower-lows and lower-highs. Gap resistance is the current battle between 3975 and 4020, a zone that if cleared would remove a formidable cap that the market has been shooting against for weeks. Whether this move above this zone is realized by a near-term swoop higher or followed by a retest of levels of support below is open to debate, but we are waiting for this zone to be removed as a threat in order to become more aggressive in stocks for the back half of the year rebound that we have been forecasting. Momentum indicators continue to inch above their middle lines, alleviating some of the bearish characteristics that have been persistent since the year began.
Today, in our Market Outlook to subscribers we discuss the following:
- The strain that may be realized in the consumer staples sector on Tuesday and how we are exposed to this traditionally defensive bet
- Ratings changes in this week’s chart books: Find out what we have upgraded to Accumulate this week
- Fertilizer stocks
Subscribers can look for this report in their inbox or by clicking on the following link and logging in: Market Outlook for July 26
Not signed up yet? Subscribe now to receive full access to all of the research and analysis that we publish.
Want to know which areas of the market to buy or sell? Our Weekly Chart Books have just been updated, providing a clear Accumulate, Avoid, or Neutral rating for currencies, cryptocurrencies, commodities, broad markets, and subsectors/industries of the market. Subscribers can login and click on the relevant links to access.
Subscribe now.
Sentiment on Monday, as gauged by the put-call ratio, ended neutral at 0.96.
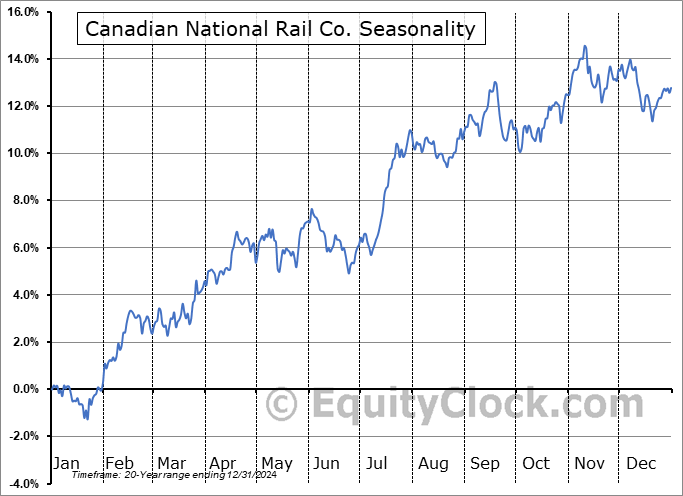
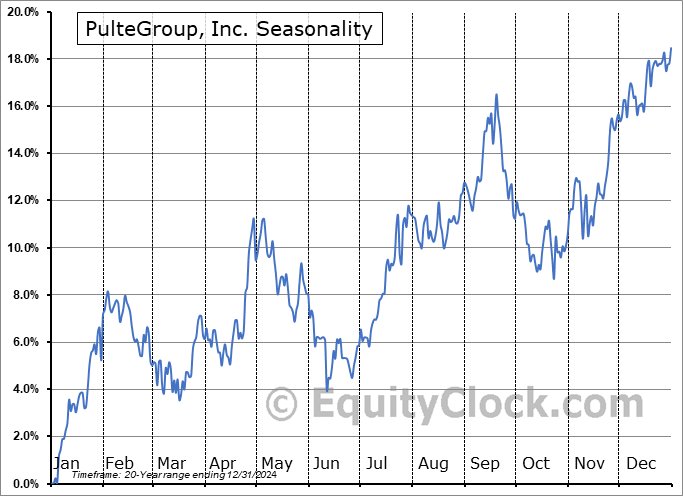
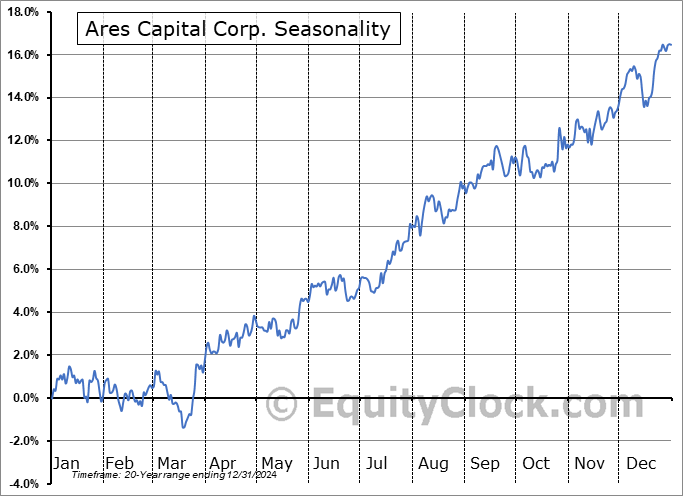
Seasonal charts of companies reporting earnings today:
S&P 500 Index
TSE Composite
| Sponsored By... |

|


