Stock Market Outlook for July 8, 2022

The reset of the price of Natural Gas and the ongoing favourable fundamental backdrop is providing us another shot to gain exposure to this commodity.
*** Stocks highlighted are for information purposes only and should not be considered as advice to purchase or to sell mentioned securities. As always, the use of technical and fundamental analysis is encouraged in order to fine tune entry and exit points to average seasonal trends.
Stocks Entering Period of Seasonal Strength Today:
Subscribers – Click on the relevant link to view the full profile. Not a subscriber? Signup here.

CYREN Ltd. (NASD:CYRN) Seasonal Chart

Technology Select Sector SPDR Fund (NYSE:XLK) Seasonal Chart

WisdomTree Japan Hedged SmallCap Equity Fund (NASD:DXJS) Seasonal Chart

Goldman Sachs Group, Inc. (NYSE:GS) Seasonal Chart

Innergex Renewable Energy Inc. (TSE:INE.TO) Seasonal Chart

Booz Allen Hamilton Holding Corp. (NYSE:BAH) Seasonal Chart

SPDR S&P Dividend ETF (NYSE:SDY) Seasonal Chart
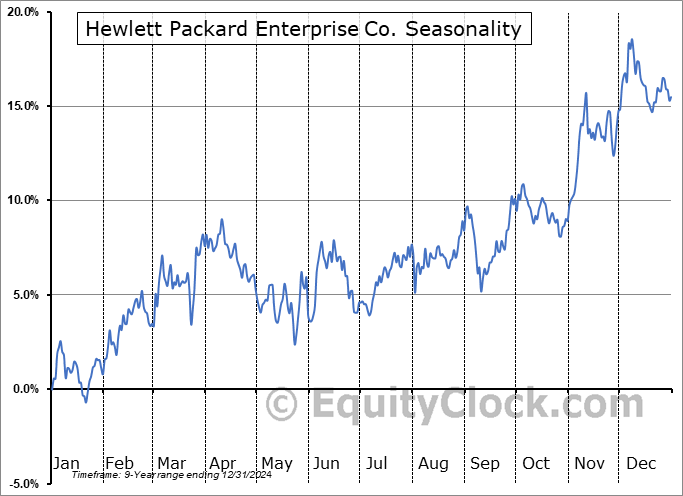
Hewlett Packard Enterprise Co. (NYSE:HPE) Seasonal Chart
The Markets
Stocks posted strong gains on Thursday as traders start to neutralize negative bets given the waning downside momentum observed in recent days/weeks. The S&P 500 Index closed higher by 1.50%, retaking levels above its declining 20-day moving average for the first time since the start of June. Declining trendline resistance, representing the upper limit to a declining wedge pattern, was tested at the highs of the day around 3900 as the intermediate path of lower-lows and lower-highs is put to the test. A definitive break above this hurdle could unleash a massive mean reversion move as the overwhelming negative sentiment that has prevailed over the past few weeks is unwound. Friday’s payroll report and the latest read of consumer prices via the Consumer Price Index report for June, slated to be released next week, will have a lot to say about the direction of stocks heading into the third quarter. While the summer rally period for stocks typically persists through the first few weeks of July, stocks can start to falter beyond the first week of the month of July, warranting a heighten level of alertness as we venture more towards the middle of the month and the start of earnings season. Evidence of waning downside pressures can continue to be picked out on the chart, often a precursor event to a turning point of the negative trend of the market.

Today, in our Market Outlook to subscribers, we discuss the following:
- The gravitation back towards growth in the market
- Weekly jobless claims and the health of the labor market
- A look ahead to the Non-Farm Payroll report for June
- Natural Gas
Subscribers can look for this report in their inbox or by clicking on the following link and logging in: Market Outlook for July 8
Not signed up yet? Subscribe now to receive full access to all of the research and analysis that we publish.
Sentiment on Thursday, as gauged by the put-call ratio, ended bullish at 0.82.

Seasonal charts of companies reporting earnings today:
- No significant earnings scheduled for today
S&P 500 Index


TSE Composite


| Sponsored By... |

|


