Stock Market Outlook for July 7, 2022

While May’s report on Job Openings and Labor Turnover continued to indicate that openings remain plentiful, there are elements within that are consistent with the run-up to an economic recession.
*** Stocks highlighted are for information purposes only and should not be considered as advice to purchase or to sell mentioned securities. As always, the use of technical and fundamental analysis is encouraged in order to fine tune entry and exit points to average seasonal trends.
Stocks Entering Period of Seasonal Strength Today:
Subscribers – Click on the relevant link to view the full profile. Not a subscriber? Signup here.
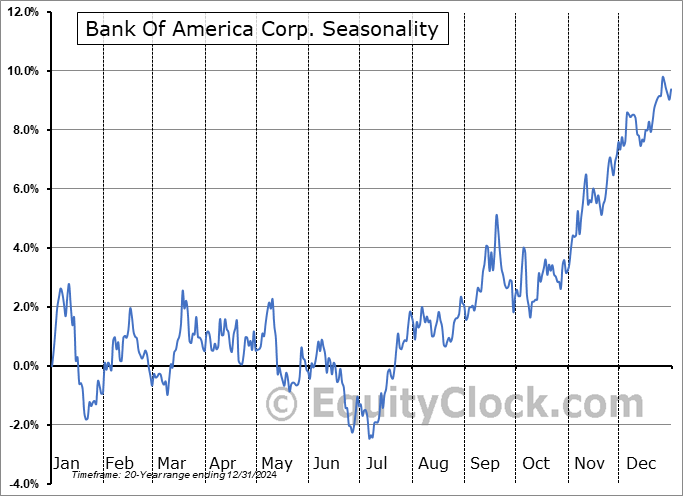
Bank Of America Corp. (NYSE:BAC) Seasonal Chart

United Parcel Service, Inc. (NYSE:UPS) Seasonal Chart

CF Industries Holdings, Inc. (NYSE:CF) Seasonal Chart

Nasdaq OMX Group Inc. (NASD:NDAQ) Seasonal Chart

Canadian Imperial Bk Comm (NYSE:CM) Seasonal Chart

Financial Select Sector SPDR Fund (NYSE:XLF) Seasonal Chart
The Markets
Stocks gained on Wednesday as the market continues to try to solidify a footing ahead of the start of earnings season ahead. The S&P 500 Index gained just over a third of one percent, ending just slightly above the declining 20-day moving average for the first time since the start of June. A higher short-term low above the June bottom continues to become apparent in what could draw in the broad participation that we had been seeking for of the summer rally period for stocks that stretches through the first few weeks of July. Price remains within the limits of a declining wedge pattern, which is indication of waning selling momentum as the bears start to lose their grip on the downside trajectory. The buy point for such as setup is typically realized upon a breakout of the upper-limit of the narrowing range, which, in this case, is around 3900, or a mere 30-points above Wednesday’s high. As highlighted in our monthly report, segments of the market that led the downside momentum through the first half of the year are increasingly showing signs of bottoming, setting the stage for what could be the first reliable rebound attempt in the market since the end of March mean-reversion rally.

Today, in our Market Outlook to subscribers, we discuss the following:
- Hourly look at the large-cap benchmark and our new level to shoot equity exposure off of
- Job Openings, Hires, and Quits
- US Factory Orders
Subscribers can look for this report in their inbox or by clicking on the following link and logging in: Market Outlook for July 7
Not signed up yet? Subscribe now to receive full access to all of the research and analysis that we publish.
Sentiment on Wednesday, as gauged by the put-call ratio, ended bullish at 0.87.

Seasonal charts of companies reporting earnings today:


S&P 500 Index


TSE Composite


| Sponsored By... |

|


