Stock Market Outlook for June 21, 2022

Energy sector ETF has pulled back to test rising trendline support, however, we have lost one of the three prongs to our approach.
*** Stocks highlighted are for information purposes only and should not be considered as advice to purchase or to sell mentioned securities. As always, the use of technical and fundamental analysis is encouraged in order to fine tune entry and exit points to average seasonal trends.
Stocks Entering Period of Seasonal Strength Today:
Subscribers – Click on the relevant link to view the full profile. Not a subscriber? Signup here.

Apple, Inc. (NASD:AAPL) Seasonal Chart
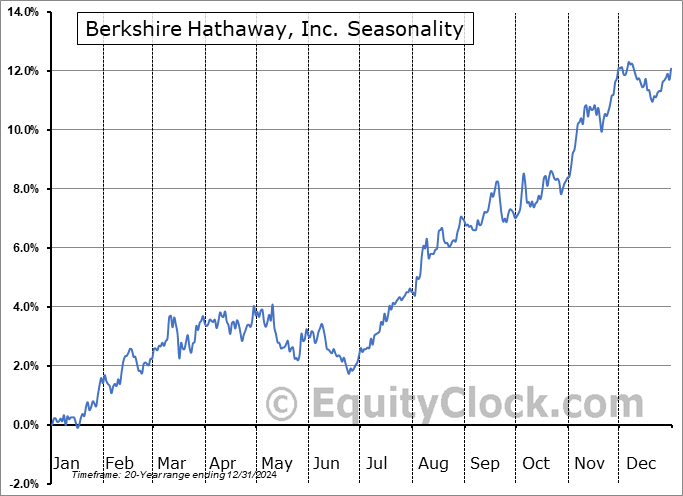
Berkshire Hathaway, Inc. (NYSE:BRK/B) Seasonal Chart

Discover Financial Services (NYSE:DFS) Seasonal Chart

Modine Manufacturing Co. (NYSE:MOD) Seasonal Chart

Direxion Daily Retail Bull 3x Shares (NYSE:RETL) Seasonal Chart

Aberdeen Standard Physical Swiss Gold Shares ETF (NYSE:SGOL) Seasonal Chart

Aberdeen Standard Physical Silver Shares ETF (NYSE:SIVR) Seasonal Chart

iShares Silver Bullion ETF (TSE:SVR.TO) Seasonal Chart
Note: There will be no report released on Monday as a result of the Juneteenth holiday closure of the US equity markets. The next report will be released on Tuesday.
The Markets
Stocks attempted to stabilize into the end of the week as a rebound technology names helped to elevate broader market benchmarks off of their lows. The S&P 500 Index closed with a gain of just over two-tenths of one percent, charting a rather indecisive doji candlestick below declining trendline support. With a selloff into the close ahead of the long weekend, this was not the type of trading action desired to suggest a significant low for stocks. Momentum indicators continue to show characteristics of a bearish trend with RSI bordering oversold territory just above 30 and MACD moving back to the lows of the year. The benchmark remains severely stretched to the downside and, as we get into the mean-reversion period for the market in the remaining days of month, followed by the start of the summer rally period, it will be difficult for the bears to maintain this condition into month and quarter-end.

Today, in our Market Outlook to subscribers, we discuss the following:
- Weekly look at the large-cap benchmark and the level of significance below
- Energy Sector ETF testing long-term rising trendline support
- The start of the optimal holding period for Apple (AAPL): A look at the technicals and the fundamentals
- US Industrial Production
Subscribers can look for this report in their inbox or by clicking on the following link and logging in: Market Outlook for June 21
Not signed up yet? Subscribe now to receive full access to all of the research and analysis that we publish.
Sentiment on Friday, as gauged by the put-call ratio, ended bearish at 1.17.

Seasonal charts of companies reporting earnings today:


S&P 500 Index


TSE Composite


| Sponsored By... |

|


