Stock Market Outlook for June 10, 2022

While the fundamental backdrop still leans bullish for the price of Natural Gas, the period of seasonal weakness ahead for the commodity could take the commodity off of its positive trend.
*** Stocks highlighted are for information purposes only and should not be considered as advice to purchase or to sell mentioned securities. As always, the use of technical and fundamental analysis is encouraged in order to fine tune entry and exit points to average seasonal trends.
Stocks Entering Period of Seasonal Strength Today:
Subscribers – Click on the relevant link to view the full profile. Not a subscriber? Signup here.
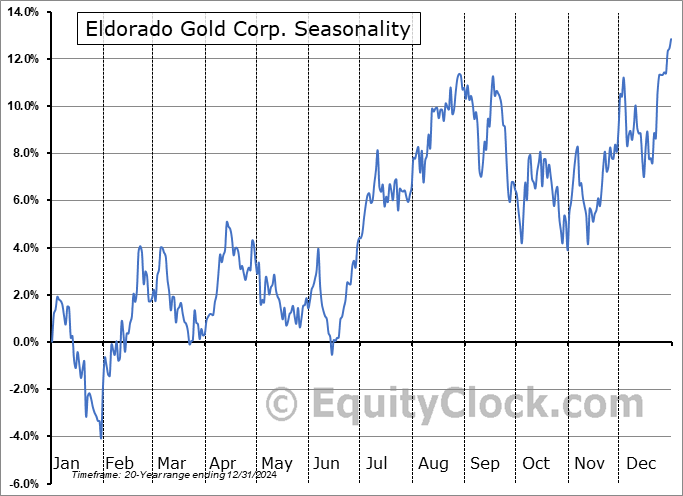
Eldorado Gold Corp. (TSE:ELD.TO) Seasonal Chart
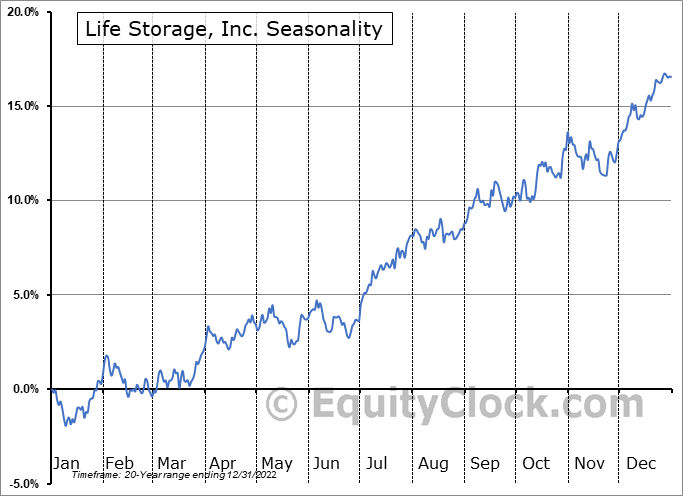
Life Storage, Inc. (NYSE:LSI) Seasonal Chart

Matson, Inc. (NYSE:MATX) Seasonal Chart

ASA Gold and Precious Metals Ltd. (NYSE:ASA) Seasonal Chart

iShares Russell Top 200 ETF (NYSE:IWL) Seasonal Chart

Invesco Emerging Markets Sovereign Debt ETF (NYSE:PCY) Seasonal Chart

Ventas, Inc. (NYSE:VTR) Seasonal Chart

Bank of Montreal (TSE:BMO.TO) Seasonal Chart
The Markets
Stocks took a leg lower on Thursday as investors became frustrated with the lack of momentum the market had been showing in recent days. The S&P 500 Index dipped by 2.38%, breaking below its 20-day moving average. The move brings an end to the recent consolidation range between 4070 and 4170, lending itself to a downside move of the same magnitude of the prevailing 100-point range. Momentum indicators are rolling over with MACD closing in on its signal line and the Relative Strength Index (RSI) slipping below its middle line. The evolving path of lower-lows and lower-highs on an intermediate scale appears to be resuming. We are now firmly into this period of June when we expected digestion of the oversold bounce and a retest of the May lows as the stage becomes set for the summer rally period that plays out starting around the end of June. A successful test of levels above the May low at 3810 would reinvigorate broader buying demand and allow for a more sustained rally in stocks through the start of the third quarter. May’s Consumer Price Index (CPI) report that will be released on Friday will provide the next major catalyst for the market and we will provide a complete breakdown of the results to subscribers intraday.

Today, in our Market Outlook to subscribers, we discuss the following:
- Stocks being rejected around their declining 50-day moving averages
- The bounce of the US Dollar Index from its rising 50-day moving average
- The change that we are enacting in the Super Simple Seasonal Portfolio
- Weekly Jobless Claims and the health of the labor market
- Natural gas inventories and the period of seasonal weakness that is directly ahead
- US Consumer Credit
Subscribers can look for this report in their inbox or by clicking on the following link and logging in: Market Outlook for June 10
Not signed up yet? Subscribe now to receive full access to all of the research and analysis that we publish.
Sentiment on Thursday, as gauged by the put-call ratio, ended bearish at 1.05.

Seasonal charts of companies reporting earnings today:
- No significant earnings scheduled for today
S&P 500 Index


TSE Composite


| Sponsored By... |

|


