Stock Market Outlook for June 9, 2022

Despite record high gas prices, demand for the commodity has rebounded and is now at the high of the year.
*** Stocks highlighted are for information purposes only and should not be considered as advice to purchase or to sell mentioned securities. As always, the use of technical and fundamental analysis is encouraged in order to fine tune entry and exit points to average seasonal trends.
Stocks Entering Period of Seasonal Strength Today:
Subscribers – Click on the relevant link to view the full profile. Not a subscriber? Signup here.

Vanguard Mega Cap ETF (NYSE:MGC) Seasonal Chart

Global X Nasdaq 100 Covered Call ETF (NASD:QYLD) Seasonal Chart

Pacer Trendpilot 100 ETF (AMEX:PTNQ) Seasonal Chart

Microsoft Corp. (NASD:MSFT) Seasonal Chart

Franchise Group Inc (NASD:FRG) Seasonal Chart

NextEra Energy Inc. (NYSE:NEE) Seasonal Chart
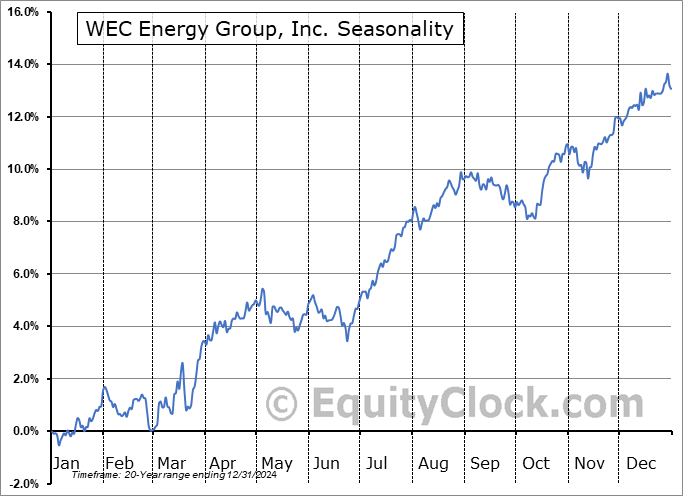
WEC Energy Group, Inc. (NYSE:WEC) Seasonal Chart
The Markets
Stocks drifted lower on Wednesday as investors continue to digest the gains that were recorded at the end of May. The S&P 500 Index closed down by just over one percent, remaining within this tight consolidation range between 4070 and 4170. The break of this span is likely to be imminent, resulting in a commensurate 100-point move in the direction of the break. The suggestion of a bull flag pattern remains, but this market is clearly battling with resistance and we are moving further into this period ahead of the end of the month when a digestion and retest of the lows is expected. While we do not have the desire to race for the exits yet on our ramped up equity exposure from the middle of May, we are cognizant that our timeframe for an upside resolution of the bullish setup followed by a retest of levels closer to the May lows, all before the start of the summer rally period at the end of this month, is becoming very limited. The 20-day moving average at 4037 remains the appropriate stop, for now, for our increased equity allocation. The declining 50-day moving average, which is in a position of resistance, continues to encroach on price in what could be a cap to this rebound attempt. Momentum indicators are gradually showing signs of rolling over as the buying demand from the May lows wanes. The market is keenly intent on waiting for the results of this May’s Consumer Price Index (CPI) report that will be released on Friday in order to get a sense of the state of inflation in the economy and how aggressive the Fed will have to be to battle it.

Today, in our Market Outlook to subscribers, we discuss the following:
- The evidence of mean reversion that is pulling investors away from safe-havens in the REITs, Utilities, and Consumer Staples sectors
- Weekly EIA Petroleum Status and stocks in the energy sector
- US Wholesale Trade and the record setting increase in the level of wholesale inventories through the first four months of the year
Subscribers can look for this report in their inbox or by clicking on the following link and logging in: Market Outlook for June 9
Not signed up yet? Subscribe now to receive full access to all of the research and analysis that we publish.
Sentiment on Wednesday, as gauged by the put-call ratio, ended slightly bullish at 0.90.

Seasonal charts of companies reporting earnings today:


S&P 500 Index


TSE Composite


| Sponsored By... |

|


