Stock Market Outlook for June 6, 2022

The degradation of consumer economic data continues.
*** Stocks highlighted are for information purposes only and should not be considered as advice to purchase or to sell mentioned securities. As always, the use of technical and fundamental analysis is encouraged in order to fine tune entry and exit points to average seasonal trends.
Stocks Entering Period of Seasonal Strength Today:
Subscribers – Click on the relevant link to view the full profile. Not a subscriber? Signup here.

Verizon Communications (NYSE:VZ) Seasonal Chart
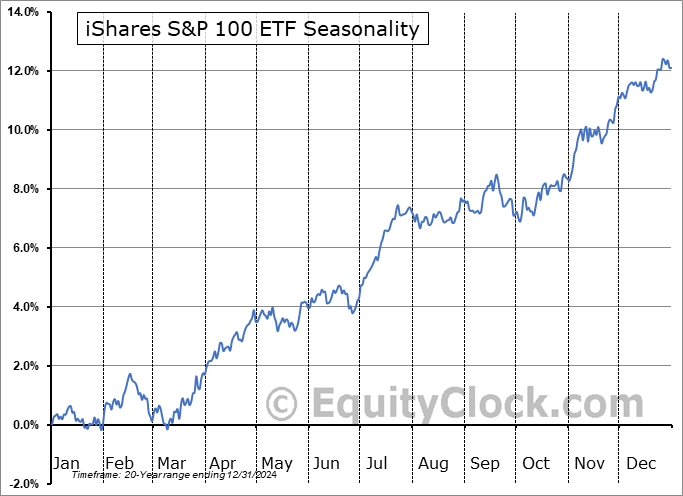
iShares S&P 100 ETF (NYSE:OEF) Seasonal Chart

Invesco Bond Fund (NYSE:VBF) Seasonal Chart

Marine Products Corp. (NYSE:MPX) Seasonal Chart

Vanguard Extended Duration Treasury ETF (NYSE:EDV) Seasonal Chart

iShares Russell Top 200 Growth ETF (NYSE:IWY) Seasonal Chart

Invesco S&P 500 Top 50 ETF (NYSE:XLG) Seasonal Chart

ProShares Ultra 20+ Year Treasury (NYSE:UBT) Seasonal Chart
The Markets
Stocks dropped on Friday as a larger than expected increase in payrolls for May once again stoked fears over how aggressive the Fed would have to be to normalize rates. The S&P 500 Index ended the day lower by 1.63%, moving back below horizontal resistance at 4150 that was cracked in the previous session. The benchmark continues to hold levels above its 20-day moving average and a flag pattern can still be implied, despite Friday’s downturn. The setup still projects an upside resolution in the short-term towards the next level of resistance around 4280, approximately coinciding with the declining 50-day moving average. A break of the shorter-term average at the 20-day at 4023 would violate the setup, warranting a retrench in our ramped up equity exposure in the Super Simple Seasonal Portfolio. Momentum indicators are showing early hints of stalling from their recent recovery from near oversold levels and characteristics of a bearish trend remain intact.

Today, in our Market Outlook to subscribers, we discuss the following:
- Weekly look at the large-cap benchmark
- US Employment Situation report and why this was not the result that the Fed desires to see
- The critical test for treasury yields (and for the summer rally)
- The improvement in gasoline demand and the jump in gasoline production to the highest level of the year
- The energy sector
Subscribers can look for this report in their inbox or click on the following link to read this report now: https://charts.equityclock.com/?newsletters_method=newsletter&id=1242
Not signed up yet? Subscribe now to receive full access to all of the content that we publish.
Sentiment on Friday, as gauged by the put-call ratio, ended bearish at 1.06.

Seasonal charts of companies reporting earnings today:


S&P 500 Index


TSE Composite


| Sponsored By... |

|


