Stock Market Outlook for May 6, 2022

Watching the comparisons of the market now to what was seen in 2018, the last time that the yield on the 10-year Treasury note crossed above 3%.
*** Stocks highlighted are for information purposes only and should not be considered as advice to purchase or to sell mentioned securities. As always, the use of technical and fundamental analysis is encouraged in order to fine tune entry and exit points to average seasonal trends.
Stocks Entering Period of Seasonal Strength Today:
Subscribers – Click on the relevant link to view the full profile. Not a subscriber? Signup here.

Churchill Downs, Inc. (NASD:CHDN) Seasonal Chart

Parkland Fuel Corp. (TSE:PKI.TO) Seasonal Chart

Ensign Group Inc. (NASD:ENSG) Seasonal Chart

iShares Core US Growth ETF (NASD:IUSG) Seasonal Chart

Invesco Dynamic Large Cap Growth ETF (NYSE:PWB) Seasonal Chart

iShares Russell 1000 Growth ETF (NYSE:IWF) Seasonal Chart

Equinix, Inc. (NASD:EQIX) Seasonal Chart

Descartes Systems Group Inc. (NASD:DSGX) Seasonal Chart
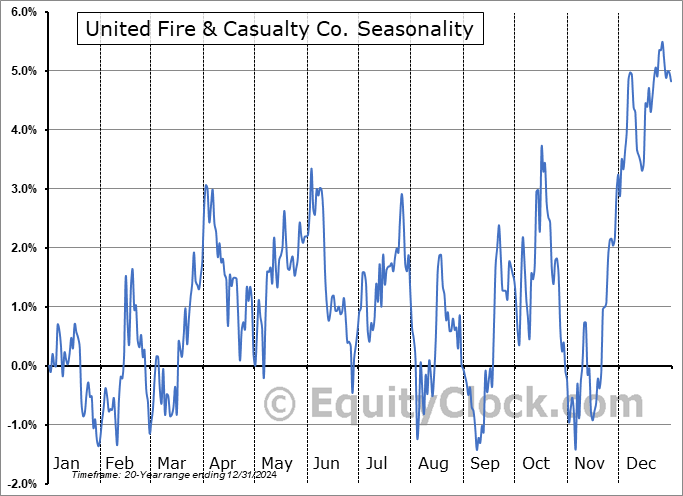
United Fire & Casualty Co. (NASD:UFCS) Seasonal Chart
The Markets
A stunning reversal of conditions on Thursday saw the strong gains realized on Wednesday following the FOMC event eliminated in very short order. The S&P 500 Index fell by 3.56%, maintaining resistance at last week’s high around 4300 and re-solidifying the hurdle that we have pegged as the neckline to the head-and-shoulders topping pattern around 4280. The threat of seeing the completion of this topping setup remains pronounced, particularly given that the equity benchmark had trouble sustaining any semblance of strength following the tremendous rally recorded just hours earlier. The topping pattern points to a downside target of 3780, which would come close to the 38.2% Fibonacci retracement level of the entire pandemic rally since the March of 2020 lows. We have been seeking weakness in the equity market to continue through the back half of the second quarter (May/June), which would take stocks to their ultimate lows ahead of the third quarter of the year. There is still no reason to doubt this forecast that is inline with how the market performs during a mid-term election year, as well as the performance of stocks surrounding the first fed funds rate increase following an easing cycle. Thursday’s abrupt downturn, throwing many off guard, hints that things could get ugly before the ultimate low in stocks is realized. Major moving averages are all pointing lower, defining negative trends across multiple timeframes. As the period of seasonal weakness for stocks gets underway, we see still see no reason to be aggressive in stocks at the present time.

Today, in our Market Outlook to subscribers, we discuss the following:
- Looking at how the equity market performed the last time that the 10-year yield crossed above 3%
- The rise in credit spreads
- The break of Bitcoin below support at the March lows
- Weekly Jobless Claims and a preview of what to expect for the monthly non-farm payroll report
Subscribe now and we’ll send this outlook to you.
Sentiment on Thursday, as gauged by the put-call ratio, ended bearish at 1.14.

Seasonal charts of companies reporting earnings today:


 Seasonal Chart")
S&P 500 Index


TSE Composite


| Sponsored By... |

|


