Stock Market Outlook for May 5, 2022

Yields and the US Dollar showing hints of peaking and we are reacting.
*** Stocks highlighted are for information purposes only and should not be considered as advice to purchase or to sell mentioned securities. As always, the use of technical and fundamental analysis is encouraged in order to fine tune entry and exit points to average seasonal trends.
Stocks Entering Period of Seasonal Strength Today:
Subscribers – Click on the relevant link to view the full profile. Not a subscriber? Signup here.
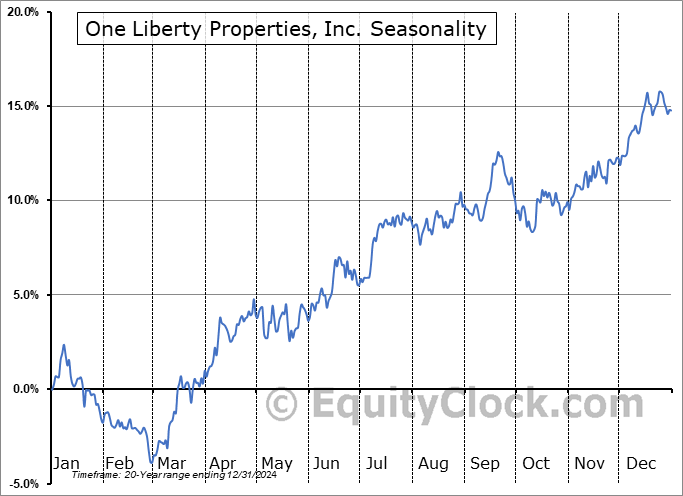
One Liberty Properties, Inc. (NYSE:OLP) Seasonal Chart

BioCryst Pharmaceuticals, Inc. (NASD:BCRX) Seasonal Chart

Firm Capital Mortgage Investment Corp. (TSE:FC.TO) Seasonal Chart

Arrow Financial Corp. (NASD:AROW) Seasonal Chart

CorVel Corp. (NASD:CRVL) Seasonal Chart

Twin Disc, Inc. (NASD:TWIN) Seasonal Chart

Qualys, Inc. (NASD:QLYS) Seasonal Chart

Horizon Global Corp. (NYSE:HZN) Seasonal Chart

Centerspace (NYSE:CSR) Seasonal Chart
The Markets
Stocks rallied sharply on Wednesday as investors found relief in comments from Fed Chair Jerome Powell, who indicated that the FOMC is not “actively considering” any individual rate hikes exceeding 50 basis points this year. The S&P 500 Index gained just shy of 3%, instantly erasing the pronounced decline recorded on Friday and closing around the highs seen one week ago. The benchmark has closed back above horizontal resistance around 4280, now stretching back towards major moving averages overhead. First up is the 20-day moving average at 4340, followed by the declining 50-day moving average close to 4375. The convergence of major moving averages around 4500 is the level that initially enticed supply to come to the market to sell and so long as the benchmark is below, there are concerns pertaining to the long-term trajectory. Momentum indicators are starting to curl higher, managing to hold above oversold territory in the midst of tremendous weakness realized in the past couple of weeks. Seasonally, beyond the first five days of May, declines are the norm thereafter until we reach the last week of the month. While the jump in prices on Wednesday is highly encouraging, aside from the rogue decline recorded on Friday, the action is still fairly typical for the end of April and the beginning of May. We’ll be watching intently to see if seasonal norms hold true as we head through the softer time of the year for stocks that starts next week.

Today, in our Market Outlook to subscribers, we discuss the following:
- Bond prices pegging a low
- US Dollar Index pegging a high
- The resolution to a consolidation range for the price of oil
- US Vehicle Sales and the leading indication that it is providing for the economy
- Job Openings and Labor Turnover Survey (JOLTs) and the leading indication that it is providing
Subscribe now and we’ll send this report to you.
Sentiment on Wednesday, as gauged by the put-call ratio, ended bearish at 1.05.

Seasonal charts of companies reporting earnings today:


 Seasonal Chart")


S&P 500 Index


TSE Composite


| Sponsored By... |

|


