Stock Market Outlook for May 4, 2022

The rise in factory inventories through the first quarter of this year has been the strongest in a decade, suggesting that, as consumer momentum slows, there is simply too much “stuff.”
*** Stocks highlighted are for information purposes only and should not be considered as advice to purchase or to sell mentioned securities. As always, the use of technical and fundamental analysis is encouraged in order to fine tune entry and exit points to average seasonal trends.
Stocks Entering Period of Seasonal Strength Today:
Subscribers – Click on the relevant link to view the full profile. Not a subscriber? Signup here.

TransDigm Group Inc. (NYSE:TDG) Seasonal Chart

Royal Gold, Inc. (NASD:RGLD) Seasonal Chart
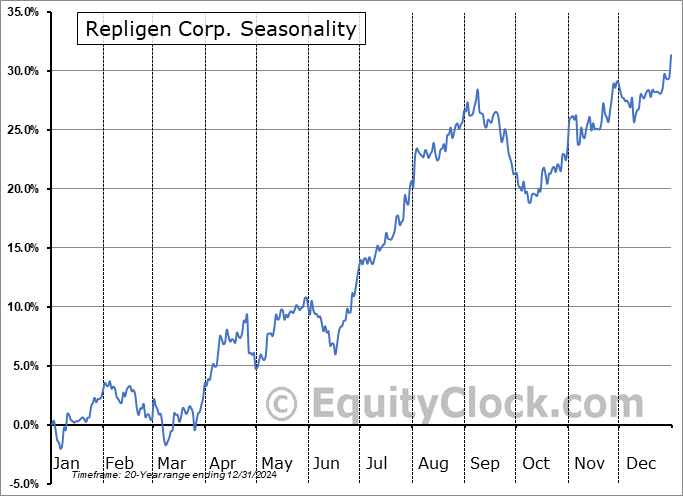
Repligen Corp. (NASD:RGEN) Seasonal Chart

iShares MSCI USA Momentum Factor ETF (AMEX:MTUM) Seasonal Chart

Wedbush ETFMG Global Cloud Technology ETF (AMEX:IVES) Seasonal Chart
The Markets
Stocks closed mildly higher on Tuesday as investors prepared for the FOMC announcement on Wednesday. The S&P 500 Index closed with a gain of just less than half of one percent, showing a rather indecisive candlestick on the day given the uncertainty that still remains over what the details the Fed statement may reveal. The benchmark has retaken levels back above the March lows, but horizontal resistance at 4280 remains the significant threat overhead, forming the neckline to the pronounced head-and-shoulders topping pattern. The 200-day moving average has started to turn lower, adopting the same slope that many of the short to intermediate moving averages have been expressing for months. Negative trends across multiple timescales are implied. With the intermediate trend of lower-highs and lower-lows, this market has much to prove in order to become reinvigorated on the long side for an upside move that could be considered sustainable. Seasonally, while stocks typically hold up through the first five days of May, they tend to dip through the middle of the month, which has led to the refrain “Sell in May and Go Away.” In our monthly outlook for May that was released to subscribers at the end of last week, we provide further insight on whether or not this strategy is truly effective and some of the segments of the market that are traditionally viable candidates for investment portfolios during this off-season for the broader equity market. Subscribe now.

Today, in our Market Outlook to subscribers, we discuss the following:
- Ratio of bonds over stocks hinting of a looming shift of trend
- Becoming aggressive in bonds by increasing duration
- US Factory Goods Orders
Subscribe now and we’ll send this outlook to you.
Sentiment on Tuesday, as gauged by the put-call ratio, ended slightly bearish at 1.05.

Seasonal charts of companies reporting earnings today:


 Seasonal Chart")


 Seasonal Chart")


S&P 500 Index


TSE Composite


| Sponsored By... |

|


