Stock Market Outlook for May 2, 2022

The S&P 500 Index has averaged a gain of a mere 0.4% in the month of May, although the gain frequency remains high at 70%.
*** Stocks highlighted are for information purposes only and should not be considered as advice to purchase or to sell mentioned securities. As always, the use of technical and fundamental analysis is encouraged in order to fine tune entry and exit points to average seasonal trends.
Stocks Entering Period of Seasonal Strength Today:
Subscribers – Click on the relevant link to view the full profile. Not a subscriber? Signup here.

Colliers International Group Inc. (TSE:CIGI.TO) Seasonal Chart

Steris plc (NYSE:STE) Seasonal Chart

Merit Medical Systems, Inc. (NASD:MMSI) Seasonal Chart

Agnico Eagle Mines Ltd. (NYSE:AEM) Seasonal Chart

ProShares Ultra Health Care (NYSE:RXL) Seasonal Chart

iShares 10-20 Year Treasury Bond ETF (NYSE:TLH) Seasonal Chart

Waste Management, Inc. (NYSE:WM) Seasonal Chart

Wheaton Precious Metals Corp. (NYSE:WPM) Seasonal Chart
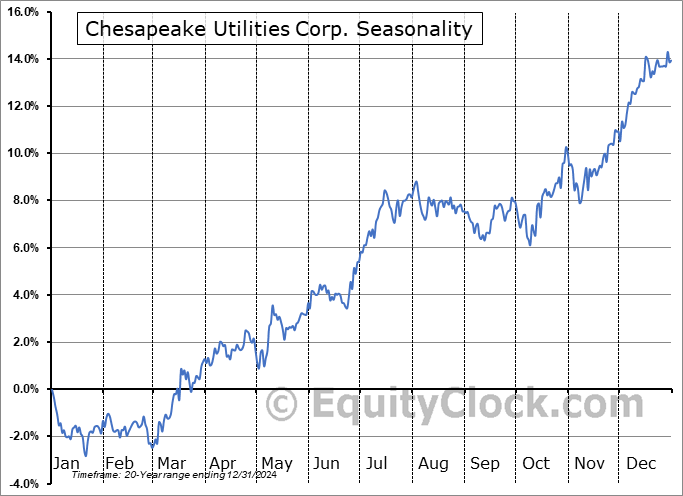
Chesapeake Utilities Corp. (NYSE:CPK) Seasonal Chart

Welltower Inc. (NYSE:WELL) Seasonal Chart
The Markets
A tough day for stocks on Friday as traders closed out the weakest April for the equity market since 1970. The S&P 500 Index dropped by 3.63%, closing below March’s lows of 4157 and confirming resistance around 4280 that has been flirted with in recent days. The risks have instantly increased that we’ll see the completion of the head-and-shoulders topping pattern that has been overhanging the market for months. The calculated magnitude of the of bearish setup points to a target of 3780 and the appearance of a bear-flag pattern just in the past week and a half points to something similar. While the downside risks remain significant, a drawdown to levels just below 4,000 may be enough to become enticed and look for signals to buy in order to become reinvigorated in stocks. Momentum indicators continue to show characteristics of a bearish trend and, other than the fact that stocks are now around 13% cheaper than what they were at the start of the year, there is no incentive to be a buyer, yet, while the market is failing to hold any level of support that can be suggested of it. Until this market is able to hold levels of support and break above levels of resistance, best to remain cautious in investment portfolios.

For the month ahead, May represents the start of the weaker six-month trend for stocks that sees returns struggle compared to the results posted in prior six months. The S&P 500 Index has averaged a gain of a mere 0.4% in this spring month, although the gain frequency remains high at 70%. Over the past two decades, returns have ranged from a loss of 8.2% in May of 2010 to a gain of 5.3% in May of 2009. The month has historically warranted a more cautious tilt in investment portfolios as the positive catalysts, if any, surrounding earnings season have largely been realized and now traders are left to their own devices to move the tape one way or the other. If there are questions pertaining to the health of the economy, as we have been witnessing in recent weeks, then stock typically have a difficult time gaining traction through the back half of the second quarter. We provide more insight of what to look out for in the month(s) ahead in our monthly report that has just been released to subscribers. Subscribe now.


Just released…
Our monthly report for May is out, providing everything that you need to know for the month(s) ahead.
Highlights in this report include:
- Equity market tendencies in the month of May
- The effectiveness of the Sell In May and Go Away strategy
- Everyone is bearish, but they may not be positioned that way
- Defense or Offense: Industry groups that provide the best of both worlds during the summer
- Opportunity to take advantage of the dip in stocks in India
- Spring is the time for real estate
- The impact of rising rates on market valuations
- Early hints that inflation is peaking
- The expansion of retailer inventories imposing a headwind on inflationary pressures
- Manufacturers ramping up activity into a slowing consumer economy
- Time to take a position in the bond market?
- US Dollar Index beyond significant resistance, posing a headwind for stocks
- Where we are in the market cycle
- Positioning for the months ahead
- Sector Reviews and Ratings
- Stocks that have Frequently Gained in the Month of May
- Notable Stocks and ETFs Entering their Period of Strength in May
Subscribers can look for this report in their inbox.
Not subscribed yet? Signup now and we’ll send this report to you.
With the new month upon us and as we celebrate the release of our monthly report for May, today we release our screen of all of the stocks that have gained in every May over their trading history. While we at Equity Clock focus on a three-pronged approach (seasonal, technical, and fundamental analysis) to gain exposure to areas of the market that typically perform well over intermediate (2 to 6 months) timeframes, we know that stocks that have a 100% frequency of success for a particular month is generally of interest to those pursuing a seasonal investment strategy. Below are the results:

And how about those securities that have never gained in this fifth month of the year, here they are:

*Note: None of the results highlighted above have the 20 years of data that we like to see in order to accurately gauge the annual recurring, seasonal influences impacting an investment, therefore the reliability of the results should be questioned. We present the above list as an example of how our downloadable spreadsheet available to yearly subscribers can be filtered.
Sentiment on Friday, as gauged by the put-call ratio, ended overly bearish at 1.33.

Seasonal charts of companies reporting earnings today:


 Seasonal Chart")


 Seasonal Chart")


 Seasonal Chart")


 Seasonal Chart")


 Seasonal Chart")

S&P 500 Index


TSE Composite


| Sponsored By... |

|


