Stock Market Outlook for April 27, 2022

Utilities sector benchmark showing similar action to what was observed prior to the pandemic plunge in stocks in March of 2020.
*** Stocks highlighted are for information purposes only and should not be considered as advice to purchase or to sell mentioned securities. As always, the use of technical and fundamental analysis is encouraged in order to fine tune entry and exit points to average seasonal trends.
Stocks Entering Period of Seasonal Strength Today:
Subscribers – Click on the relevant link to view the full profile. Not a subscriber? Signup here.
Heartland Financial USA Inc. (NASD:HTLF) Seasonal Chart
BlackRock Taxable Municipal Bond Trust (NYSE:BBN) Seasonal Chart
Terminix Global Holdings, Inc. (NYSE:TMX) Seasonal Chart
ProShares Ultra Consumer Goods (NYSE:UGE) Seasonal Chart
Valvoline Inc. (NYSE:VVV) Seasonal Chart
Arch Coal, Inc. (NYSE:ARCH) Seasonal Chart
The Markets
Another brutal day for stocks as the “sell everything” mentality in the market continues. The S&P 500 Index shed 2.81%, making another swing below significant horizontal support at 4280 and elevating the likelihood that we see further downside resolution to the head-and-shoulders topping pattern that has loomed overhead all year. The March lows around 4157 are directly below, providing the first target for the benchmark to shoot off of heading into the end of the month, a timeframe that should see a short-term reprieve in some of the selling pressures until we move beyond the first few days of May. Short and intermediate-term trends remain negative, as indicated by the direction of the 20 and 50-day moving averages, and resistance at the 200-day moving average risks longer-term negative implications. Momentum indicators are readopting characteristics of a bearish trend and are quickly closing in on oversold extremes. Aside from the possibility of a short-term bounce through the last few days of April/first few days of May, this is still a market that warrants a cautious bias with elevated levels of cash and (finally) bonds providing the only refuge.
Today, in our Market Outlook to subscribers, we discuss the following:
- Using bonds as a safe-haven in the “sell everything” market
- The peak in yields destined to support the beaten down growth/technology sector
- The similar look of the action in the Utilities sector to the period prior to the pandemic plunge in stocks
- US Durable Goods Orders and the rise in inventories
- US Home Prices
- US New Home Sales and the stocks of the homebuilders
Subscribe now and we’ll send this outlook to you.
Sentiment on Tuesday, as gauged by the put-call ratio, ended bearish at 1.08.
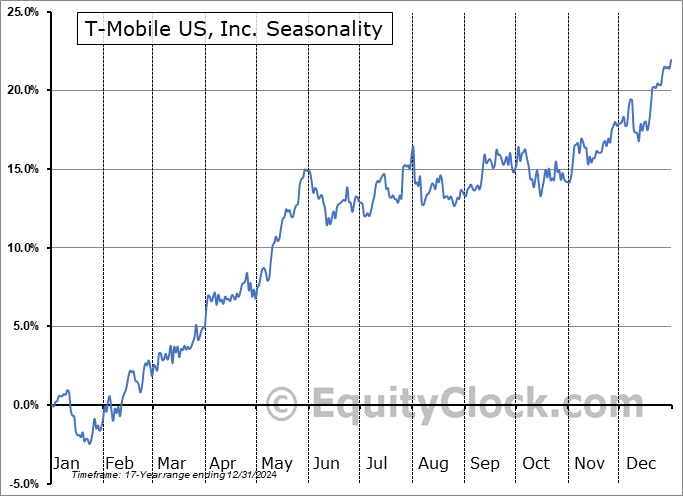
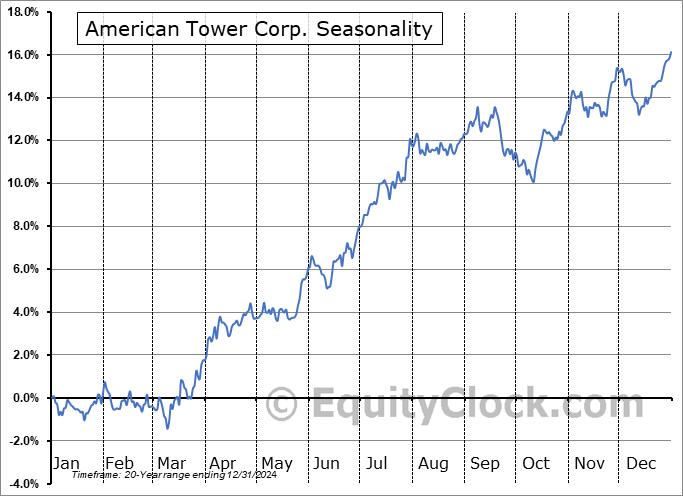
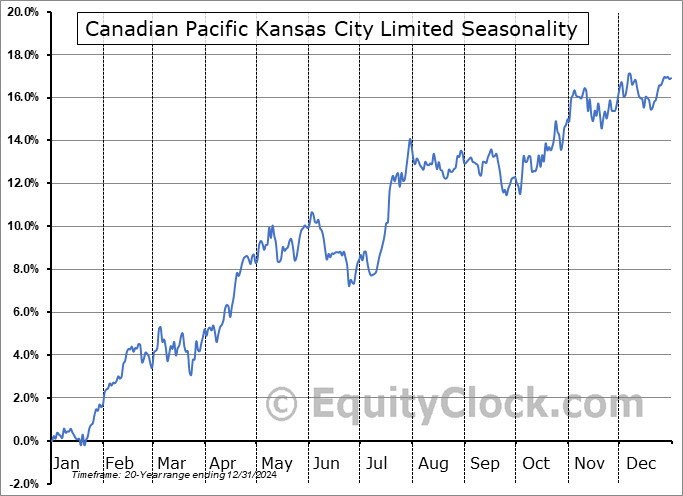
Seasonal charts of companies reporting earnings today:
S&P 500 Index
TSE Composite
| Sponsored By... |

|


