Stock Market Outlook for April 26, 2022

The atypical rise in the US Dollar is forcing a rotation in the market away from this year’s winners in resource dominated sectors.
*** Stocks highlighted are for information purposes only and should not be considered as advice to purchase or to sell mentioned securities. As always, the use of technical and fundamental analysis is encouraged in order to fine tune entry and exit points to average seasonal trends.
Stocks Entering Period of Seasonal Strength Today:
Subscribers – Click on the relevant link to view the full profile. Not a subscriber? Signup here.
Ameren Corp. (NYSE:AEE) Seasonal Chart
Vertex Pharmaceuticals Inc. (NASD:VRTX) Seasonal Chart
Equitable Group Inc. (TSE:EQB.TO) Seasonal Chart
Northern Technologies Intl Corp. (NASD:NTIC) Seasonal Chart
The Markets
From one massive reversal in the market to another. Stocks closed higher on Monday following a selloff that was realized early in the session as selling pressures moved on to this year’s winners in the energy and materials sectors. The S&P 500 Index closed higher by just under six-tenths of one percent, erasing the 1.66% decline realized by midday. The benchmark managed to retake levels above significant horizontal support at 4280, albeit marginally, giving the bulls and bears another confounding signal to debate. Short and intermediate term trends are still deemed to be negative, as indicated by the declining 20 and 50-day moving averages, and confirmed resistance at the 200-day moving average continues to hint of negative longer-term implications that could keep the market capped beyond just the few months that the benchmark has traded lower this year. Momentum indicators have been re-adopting characteristics of a bearish trend following the bullish tilt that was observed during the March mean reversion rally. The broader technical backdrop continues to have difficulty fitting into the intermediate timeframe that our seasonal strategy presents, which suggests maintaining our cautious/neutral bias that has been persistent in the Super Simple Seasonal Portfolio for much of the year (but we are shuffling the deck with some of the positions, as highlighted below).
Today, in our Market Outlook to subscribers, we discuss the following:
- The breakout on the US Dollar Index forcing a rotation in the equity market
- Breakdown of the rising trend in the energy sector
- Notable ratings changes in this week’s chart books
- US Treasury bonds prices and the change we are enacting in the Super Simple Seasonal Portfolio
- Have technology stocks stopped falling?
Subscribe now and we’ll send this outlook to you.
Want to know which areas of the market to buy or sell? Our Weekly Chart Books have just been updated, providing a clear Accumulate, Avoid, or Neutral rating for currencies, cryptocurrencies, commodities, broad markets, and subsectors/industries of the market. Subscribers can login and click on the relevant links to access.
Subscribe now.
Sentiment on Monday, as gauged by the put-call ratio, ended bearish at 1.16.
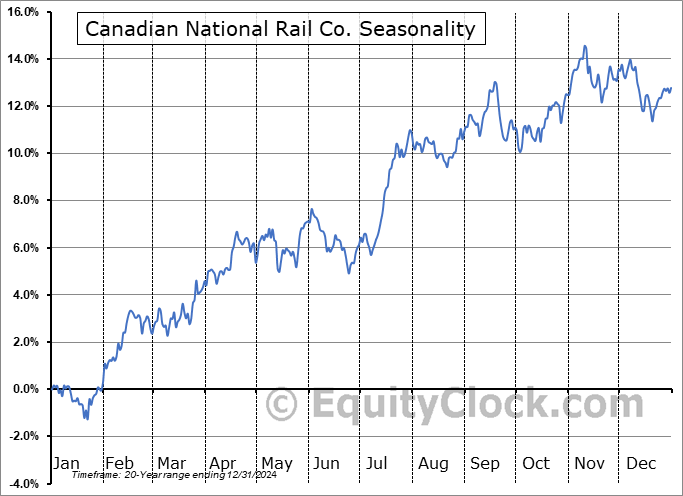
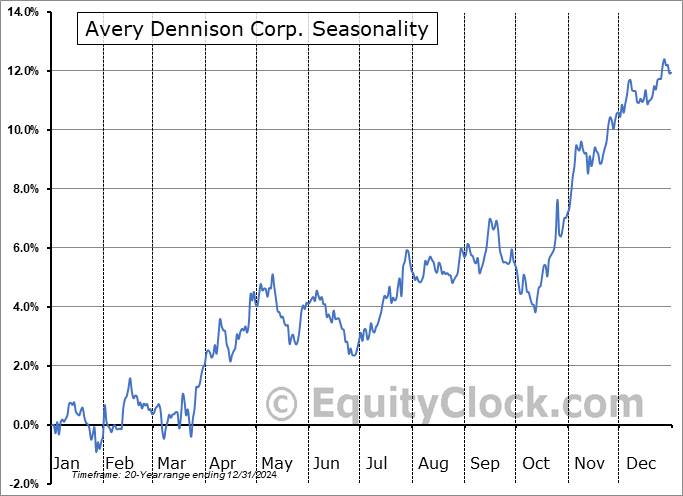
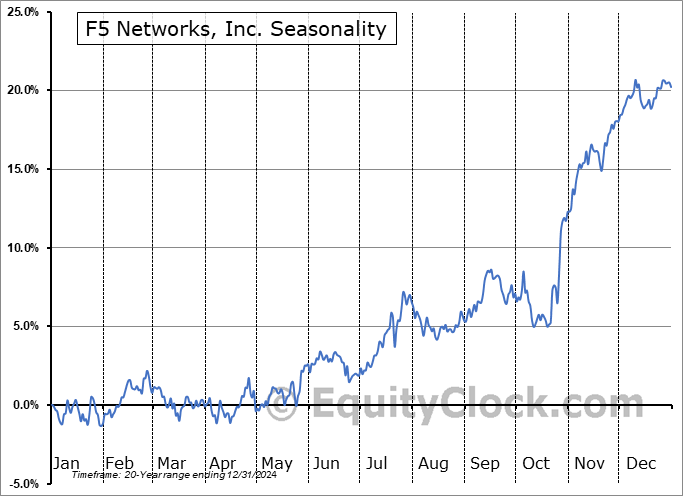
Seasonal charts of companies reporting earnings today:
S&P 500 Index
TSE Composite
| Sponsored By... |

|


