Stock Market Outlook for April 22, 2022

We’re taking profits in a number of seasonal trades that have each returned over 40% in just a few months.
*** Stocks highlighted are for information purposes only and should not be considered as advice to purchase or to sell mentioned securities. As always, the use of technical and fundamental analysis is encouraged in order to fine tune entry and exit points to average seasonal trends.
Stocks Entering Period of Seasonal Strength Today:
Subscribers – Click on the relevant link to view the full profile. Not a subscriber? Signup here.
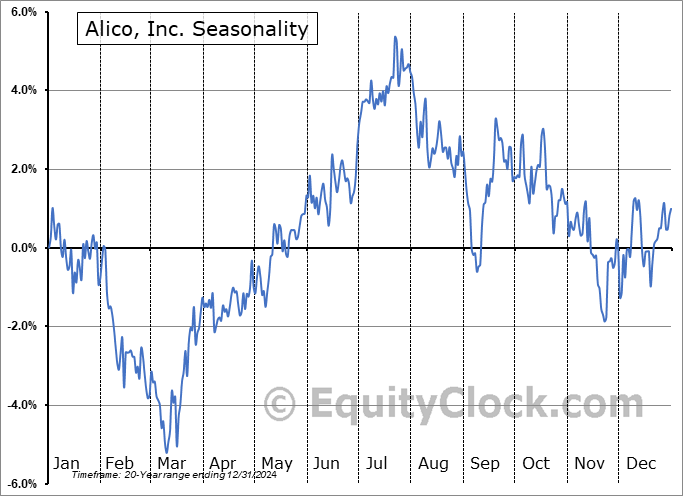
Alico, Inc. (NASD:ALCO) Seasonal Chart

BlackRock Muni Income Fund (NYSE:BLE) Seasonal Chart

Edgewell Personal Care Co. (NYSE:EPC) Seasonal Chart

SPDR S&P 500 Growth ETF (NYSE:SPYG) Seasonal Chart
The Markets
Stocks reversed early day gains to close sharply lower on Thursday’s session as rate pressures continue to weigh. The S&P 500 Index ended down by 1.48%, closing back below the 50-day moving average it had been dancing around in recent days. The reversal was realized directly around the convergence of moving averages we have been highlighting in recent days near 4500, emphasizing the significance of this zone as resistance. This is a threatening mark on the benchmark at a point of long-term resistance at the 200-day moving average that sets the market on alert for the continuation of the decline that was realized during the first quarter. The start of the week low around 4370 present a minor point of short-term support, but the inability of the benchmark to take levels back above the 200-day moving average has longer-term negative implications and warrants caution so long as we are below. As pointed out in yesterday’s report, mid-term election years average a peak in the market around the middle of April, leading to declines thereafter into the summer. Thursday’s reversal could be argued as being the start of this normal trend. The 20 and 50-day moving averages are pointing lower, highlighting negative short and intermediate trends.

Today, in our Market Outlook to subscribers, we discuss the following:
- The outside reversal session on the TSX Composite
- Philadelphia Fed Manufacturing Survey
- The downfall of resource stocks
- Weekly Jobless Claims and the health of the labor market
- Natural gas inventories and the seasonal trade in the commodity
Subscribe now and we’ll send this outlook to you.
Sentiment on Thursday, as gauged by the put-call ratio, ended bearish at 1.12.

Seasonal charts of companies reporting earnings today:


S&P 500 Index


TSE Composite


| Sponsored By... |

|


