Stock Market Outlook for April 18, 2022

Retail sales may be surging, but so too are inventories, which poses a problem for the growth in the economy.
*** Stocks highlighted are for information purposes only and should not be considered as advice to purchase or to sell mentioned securities. As always, the use of technical and fundamental analysis is encouraged in order to fine tune entry and exit points to average seasonal trends.
Stocks Entering Period of Seasonal Strength Today:
Subscribers – Click on the relevant link to view the full profile. Not a subscriber? Signup here.

Republic Bancorp, Inc. (NASD:RBCAA) Seasonal Chart

Ally Financial Inc. (NYSE:ALLY) Seasonal Chart

Schlumberger Ltd. (NYSE:SLB) Seasonal Chart

TC Energy Corp. (NYSE:TRP) Seasonal Chart

Crocs, Inc. (NASD:CROX) Seasonal Chart

Suburban Propane Partners LP (NYSE:SPH) Seasonal Chart

Westport Innovations, Inc. (TSE:WPRT.TO) Seasonal Chart

Global Healthcare Income & Growth ETF (TSE:HIG.TO) Seasonal Chart

ServiceNow, Inc. (NYSE:NOW) Seasonal Chart

IAMGold Corp. (TSE:IMG.TO) Seasonal Chart

Northwest Natural Gas (NYSE:NWN) Seasonal Chart
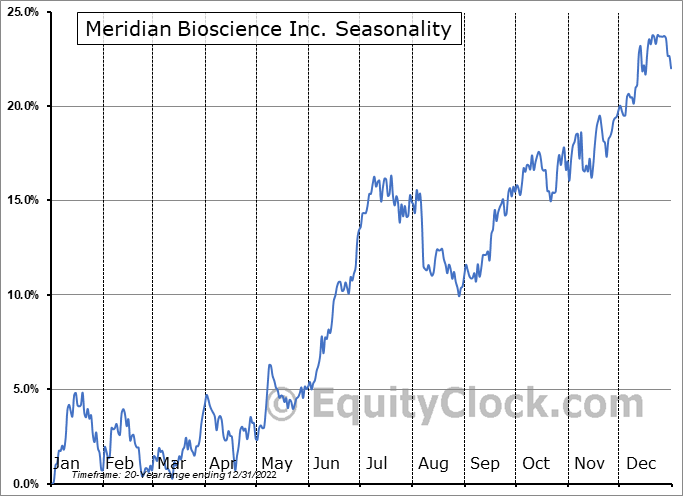
Meridian Bioscience Inc. (NASD:VIVO) Seasonal Chart

iShares Global Healthcare Index ETF (CAD-Hedged) (TSE:XHC.TO) Seasonal Chart
The Markets
The back-and-forth gyrations in the market continue as the cost of borrowing takes another leg higher. The S&P 500 Index fell by 1.21%, giving back the prior session’s gain and slipping back below the 50-day moving average. A congestion below Monday’s downside gap between 4465 and 4480, as well as major moving averages, has developed. Moving averages are largely intersecting in the 4500 to 4520 zone, a hurdle that is likely to need a catalyst to overcome. The 20-day and 50-day moving averages have started to roll over again following the end of March mean-reversion rally and our caution for the intermediate-term trajectory of the market is now elevated. Below current levels, 4280 remains the make-or-break level to this market where a significant dip below could lead to a cascading decline similar to what was observed in the last quarter of 2018 when rate fears similarly sent a flurry of sell orders into the market. The market has reached the end of the period that we saw as likely to show a rebound between the middle of March and the middle of April and therefore we must be on guard to make our next move to execute on our playbook that has kept us on the right path, so far, this year.

Today, in our Market Outlook to subscribers, we discuss the following:
- Weekly look at the large-cap benchmark
- The change being enacted in the Super Simple Seasonal Portfolio
- US Retail Sales
- Retailer Inventories
- Canada Manufacturing Sales
- Investor Sentiment
Subscribe now and we’ll send this outlook to you.
Sentiment on Thursday, as gauged by the put-call ratio, ended close to neutral at 0.93.

Seasonal charts of companies reporting earnings today:


S&P 500 Index


TSE Composite


| Sponsored By... |

|


