Stock Market Outlook for April 12, 2022

Bond ETFs have moved lower in a parabolic manner, making their trajectories unsustainable.
*** Stocks highlighted are for information purposes only and should not be considered as advice to purchase or to sell mentioned securities. As always, the use of technical and fundamental analysis is encouraged in order to fine tune entry and exit points to average seasonal trends.
Stocks Entering Period of Seasonal Strength Today:
Subscribers – Click on the relevant link to view the full profile. Not a subscriber? Signup here.

Molina Healthcare, Inc. (NYSE:MOH) Seasonal Chart
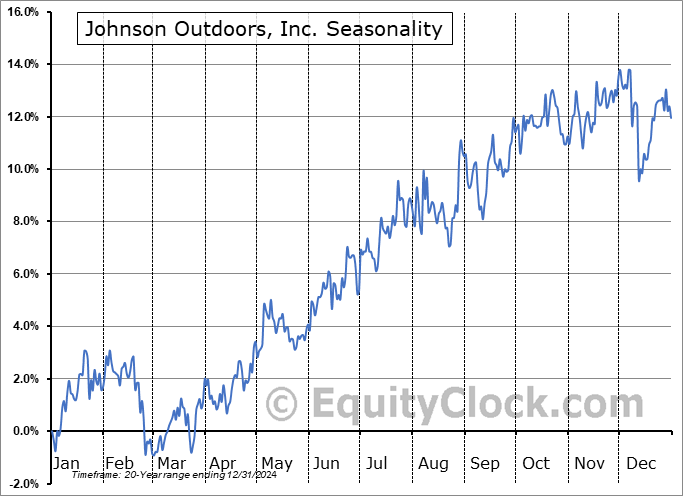
Johnson Outdoors, Inc. (NASD:JOUT) Seasonal Chart

Veeva Systems Inc. (NYSE:VEEV) Seasonal Chart

iShares Global Healthcare ETF (NYSE:IXJ) Seasonal Chart
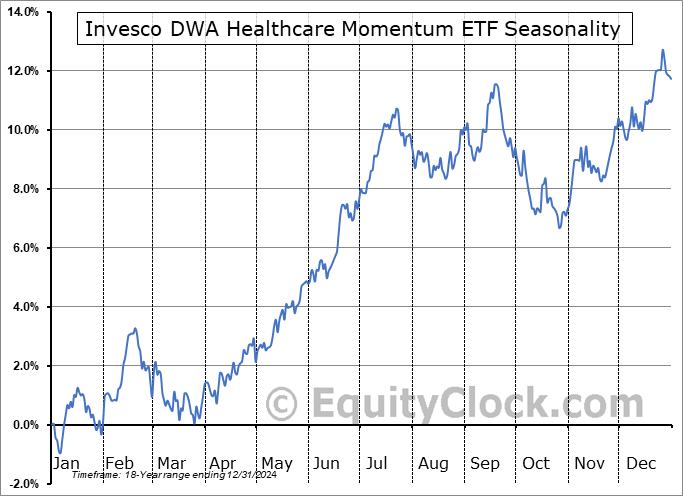
Invesco DWA Healthcare Momentum ETF (NASD:PTH) Seasonal Chart
The Markets
Stocks sold off in the first session of the holiday shortened week as rate and economic slowdown fears once again gripped the market. The S&P 500 Index dropped by 1.69%, gapping below its rising 20-day moving average and moving below its 50-day moving average that had started to curl higher in recent weeks. As with the gap charted last week between 4495 and 4515, Monday’s gap plots another point of resistance between 4465 and 4480 and gradually the levels of resistance are once again outweighing levels of support. The next line in the sand below is 4400. Momentum indicators continue to point lower, although the rising trends with respect to RSI and MACD remain unbroken. While this market is becoming more treacherous by the day, admittedly there are still a number of attributes that could lend itself to either a bullish or bearish near-term bias. The trend of lower-lows and lower-highs in the market that dominated the trading action through the first 10 weeks of the year has been violated with the end of March move above the mid-February high, but with all major moving averages now violated and two notable gaps overhead, the near-term trajectory certainly is not showing the characteristics that are desired to be aggressively long. The market remains in this seasonally strong month of April and, while the price action thus far has failed to reflect this average strength, it would be unprecedented in a non-recessionary period to fuel a significant wave of selling pressures ahead of/during earnings season and surrounding the US tax contribution deadline. With this in mind, we are obligated to give the market some kind of benefit of the doubt, but our window to look to de-risk following the expected mid-March though to mid-April bump is coming up fast and we are reluctant to exhaust the gains derived during the first half of this trade in the back half of March.

Today, in our Market Outlook to subscribers, we discuss the following:
- Closing in on the target of the short-term head-and-shoulders topping pattern for the S&P 500 Index
- Gauging the strength of the market by looking at the riskiest segments of it
- Equally Weighted S&P 500 Index
- Notable upgrades and downgrades in this week’s chartbooks
- The parabolic decline in bond prices
Subscribe now and we’ll send this outlook to you.
Want to know which areas of the market to buy or sell? Our Weekly Chart Books have just been updated, providing a clear Accumulate, Avoid, or Neutral rating for currencies, cryptocurrencies, commodities, broad markets, and subsectors/industries of the market. Subscribers can login and click on the relevant links to access.
Subscribe now.
Sentiment on Monday, as gauged by the put-call ratio, ended bearish at 1.04.

Seasonal charts of companies reporting earnings today:


S&P 500 Index


TSE Composite


| Sponsored By... |

|


