Stock Market Outlook for April 7, 2022

The yield on the 10-Year Treasury Note is now back to its declining 200-month moving average, a hurdle last tested before the dramatic selloff in stocks during the fourth quarter of 2018.
*** Stocks highlighted are for information purposes only and should not be considered as advice to purchase or to sell mentioned securities. As always, the use of technical and fundamental analysis is encouraged in order to fine tune entry and exit points to average seasonal trends.
Stocks Entering Period of Seasonal Strength Today:
Subscribers – Click on the relevant link to view the full profile. Not a subscriber? Signup here.

Merck & Co., Inc. (NYSE:MRK) Seasonal Chart

Manhattan Associates, Inc. (NASD:MANH) Seasonal Chart

World Acceptance Corp. (NASD:WRLD) Seasonal Chart

Titan Machinery Inc. (NASD:TITN) Seasonal Chart
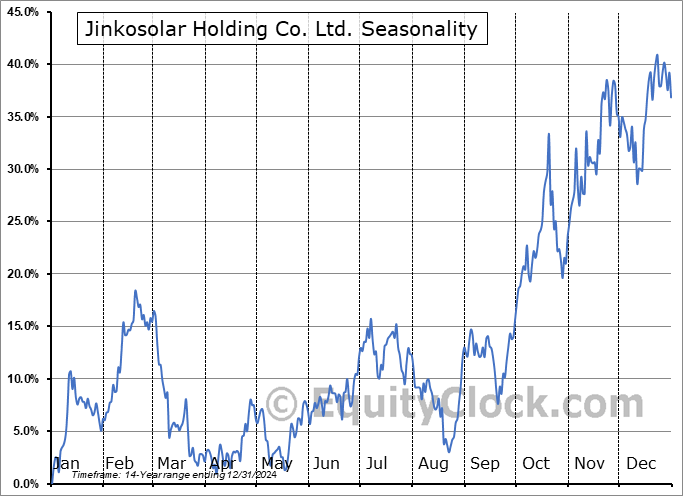
Jinkosolar Holding Co. Ltd. (NYSE:JKS) Seasonal Chart

HSBC Holdings PLC (NYSE:HSBC) Seasonal Chart

Intrepid Potash, Inc. (NYSE:IPI) Seasonal Chart

BRP Inc. (TSE:DOO.TO) Seasonal Chart
The Markets
Stocks sold off on Wednesday as the cost of borrowing once again jumped amidst ongoing comments from Fed officials that suggest the committee is adopting a more hawkish tone given that inflation has reached beyond levels of comfort. The S&P 500 Index shed just less than one percent, gapping below its 200-day moving average and reaching back towards support around the now rising 20 and 50-day moving averages. At the lows of the session, the shorter of the moving averages (the 20-day) was tested as support and the reaction to the hurdle has, so far, been positive. Still, the gap overhead between 4495 and 4515 charts a level of resistance that threatens to cap the near-term trajectory. A test and rejection from this barrier may warrant a shift towards caution. Momentum indicators continue to roll over with MACD on the verge of triggering a sell signal now that the momentum indicator has encroached on its signal line. The trends of both RSI and MACD remain that of higher-highs and higher-lows stemming from the January lows.

Today, in our Market Outlook to subscribers, we discuss the following:
- The target of a head-and-shoulders pattern on the hourly chart of the S&P 500 Index
- The breakout of a consolidation range for the US Dollar Index
- Forward and trailing Price/Earnings multiples of the market
- Earnings expectations and the correlation of forecasts to the direction of the broader market
- Correlation of market multiples to interest rates
- The rising trajectory of the Economic Surprise Index
- US petroleum inventories and demand
- The first close of the price of oil below its 50-day moving average since December
- Energy sector stocks
- The change being executed in the Super Simple Seasonal Portfolio
Subscribe now and we’ll send this outlook to you.
Sentiment on Wednesday, as gauged by the put-call ratio, ended close to neutral at 0.91.

Seasonal charts of companies reporting earnings today:


S&P 500 Index


TSE Composite


| Sponsored By... |

|


