Stock Market Outlook for March 23, 2022

The spread between the performance of this quarter’s winners and this quarter’s losers has narrowed as quarter-end mean reversion progresses.
*** Stocks highlighted are for information purposes only and should not be considered as advice to purchase or to sell mentioned securities. As always, the use of technical and fundamental analysis is encouraged in order to fine tune entry and exit points to average seasonal trends.
Stocks Entering Period of Seasonal Strength Today:
Subscribers – Click on the relevant link to view the full profile. Not a subscriber? Signup here.

Invesco S&P Global Water Index ETF (NYSE:CGW) Seasonal Chart

Eaton Vance Enhanced Equity Income Fund (NYSE:EOI) Seasonal Chart

First Trust Natural Gas ETF (NYSE:FCG) Seasonal Chart

iShares Global Energy ETF (NYSE:IXC) Seasonal Chart
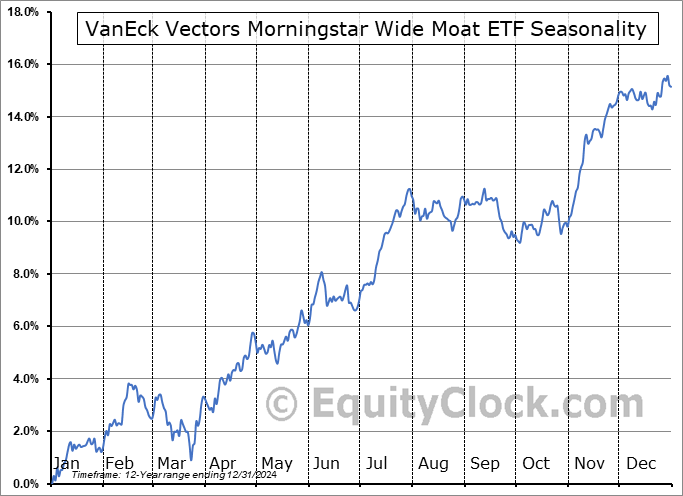
VanEck Vectors Morningstar Wide Moat ETF (AMEX:MOAT) Seasonal Chart

Summit Materials Inc. (NYSE:SUM) Seasonal Chart

Tree Island Steel Ltd. (TSE:TSL.TO) Seasonal Chart

Zoetis Inc. (NYSE:ZTS) Seasonal Chart

NRG Energy Inc. (NYSE:NRG) Seasonal Chart

Oneok, Inc. (NYSE:OKE) Seasonal Chart

AutoCanada Inc. (TSE:ACQ.TO) Seasonal Chart

Electrovaya Inc. (TSE:EFL.TO) Seasonal Chart

CAE, Inc. (TSE:CAE.TO) Seasonal Chart

Tri Pointe Homes Inc. (NYSE:TPH) Seasonal Chart
The Markets
Stocks clawed their way higher on Tuesday, shaking off the soft start to the week, as strong earnings from Nike calmed fears that the consumer was being negatively impacted by the rising cost of goods. The S&P 500 Index closed higher by 1.13%, moving back above its 200-day moving average for the first time in just over a month. There are two points of horizontal resistance that are up to bat ahead. The first being 4545, representing the early September high and the mid-December low, and the second being 4600, representing the double-top resistance high charted in February. We remain in this zone where the levels of reference remains significant due to the sheer volume of trades that were enacted in this region. The risk is that this supply hits the market should another shock headline be revealed, leading to the next down-leg in the market. As we have been portraying to subscribers, the next major downturn in the market is speculated to occur in the back half of the second quarter (May and June) and, for now, we are benefitting from our ramped up equity exposure that was enacted in the middle of the month. While the ongoing breakouts above levels of resistance does lead to the belief that we have moved beyond the declining phase that dominated the first 10 weeks of the year, a check-back of levels of support remains desired. Seasonally, the equity market remains in this strong phase through the middle of April, at which point we will be on the lookout for the next pivot point that could warrant adjusting risk exposure in the portfolio again.

Today, in our Market Outlook to subscribers, we discuss the following:
- The narrowing of the spread of performance between this quarter’s winners and losers
- Plotting the spread of COVID against seasonal norms for respiratory illnesses
- US Mobility Trends
- The snap-back in shipping metrics following a dismal start to the year
- Transportation stocks
Subscribe now and we’ll send this outlook to you.
Sentiment on Tuesday, as gauged by the put-call ratio, ended closed to neutral at 0.94.

Seasonal charts of companies reporting earnings today:


S&P 500 Index


TSE Composite


| Sponsored By... |

|

