Stock Market Outlook for March 22, 2022

The performance of the NASDAQ 100 relative to the S&P 500 Index has shed the “froth” that was derived during the pandemic and retraced back to its long-term rising range.
*** Stocks highlighted are for information purposes only and should not be considered as advice to purchase or to sell mentioned securities. As always, the use of technical and fundamental analysis is encouraged in order to fine tune entry and exit points to average seasonal trends.
Stocks Entering Period of Seasonal Strength Today:
Subscribers – Click on the relevant link to view the full profile. Not a subscriber? Signup here.

Sabine Royalty Trust (NYSE:SBR) Seasonal Chart

Canso Credit Income Fund (TSE:PBY/UN.TO) Seasonal Chart

Manulife Financial Corp. (NYSE:MFC) Seasonal Chart

Devon Energy Corp. (NYSE:DVN) Seasonal Chart
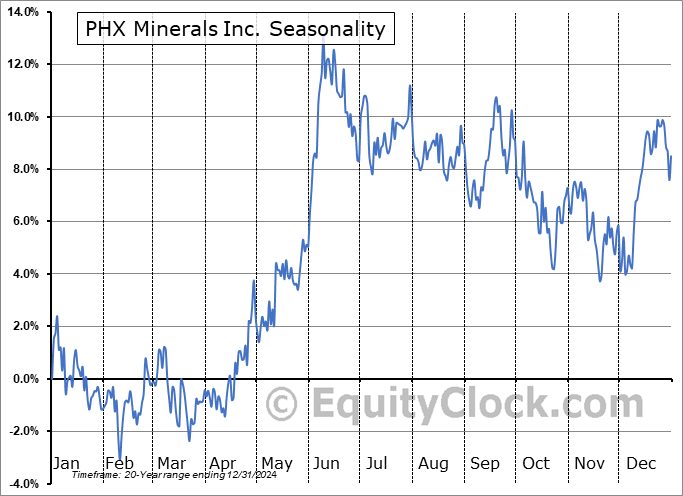
PHX Minerals Inc. (NYSE:PHX) Seasonal Chart

Movado Group, Inc. (NYSE:MOV) Seasonal Chart

HealthStream, Inc. (NASD:HSTM) Seasonal Chart

Oil States Intl (NYSE:OIS) Seasonal Chart
The Markets
Stocks drifted slightly lower on Monday, peeling back some of the gain recorded in the previous week, following a statement from Jerome Powell that indicated “inflation is much too high.” The comments raised concerns of a more hawkish Fed ahead, leading to an escalation of selling pressure in the bond market and ongoing strains in some of those high growth/high P/E names in the technology sector. The S&P 500 Index ended lower by a mere four basis points, testing the 50-day moving average as support at the lows of the session. The 200-day moving average remains threatening as a level of resistance overhead. As highlighted in Friday’s report, we are into this zone with tremendous supply and it is likely to cause investors to think twice about holding aggressive equity exposure amidst the uncertainty in the market that continues to be overwhelming. Momentum indicators have recovered from their declining trend recorded through the past few months, but with MACD still below its middle line and RSI just marginally above, characteristics of a bearish trend remain apparent. We continue to sit with our increased equity exposure that was enacted prior to last week’s massive rebound, but we are questioning how much more gas may be in the tank of this mean reversion play now that the market has done just that, mean reverted.

Today, in our Market Outlook to subscribers, we discuss the following:
- Gauging the sustainable path of the broader equity market by the trend of Small and Mid-cap benchmarks
- Relative trend of the NASDAQ 100 Index back to its long-term rising range
- Spread between 10-year and 2-year treasury yields gradually narrowing towards an inversion
- Notable ratings changes in this week’s chart books: Find out what has been upgraded to Accumulate this week
Subscribe now and we’ll send this outlook to you.
Want to know which areas of the market to buy or sell? Our Weekly Chart Books have just been updated, providing a clear Accumulate, Avoid, or Neutral rating for currencies, cryptocurrencies, commodities, broad markets, and subsectors/industries of the market. Subscribers can login and click on the relevant links to access.
Subscribe now.
Sentiment on Monday, as gauged by the put-call ratio, ended bullish at 0.88.

Seasonal charts of companies reporting earnings today:


 Seasonal Chart")


S&P 500 Index


TSE Composite


| Sponsored By... |

|

