Stock Market Outlook for March 11, 2022

Transportation stocks outperforming the market despite high energy commodity prices, but we only have one industry group that is on our list of segments to accumulate.
*** Stocks highlighted are for information purposes only and should not be considered as advice to purchase or to sell mentioned securities. As always, the use of technical and fundamental analysis is encouraged in order to fine tune entry and exit points to average seasonal trends.
Stocks Entering Period of Seasonal Strength Today:
Subscribers – Click on the relevant link to view the full profile. Not a subscriber? Signup here.

American Intl Group, Inc. (NYSE:AIG) Seasonal Chart

Perpetual Energy Inc. (TSE:PMT.TO) Seasonal Chart
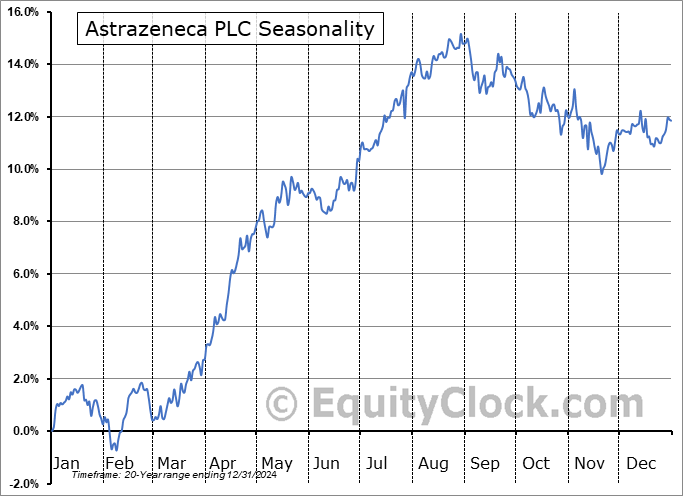
Astrazeneca PLC (NASD:AZN) Seasonal Chart

ImmunoGen, Inc. (NASD:IMGN) Seasonal Chart

Invesco S&P International Developed Quality ETF (AMEX:IDHQ) Seasonal Chart

iShares MSCI Italy Capped ETF (NYSE:EWI) Seasonal Chart

CenterPoint Energy, Inc. (NYSE:CNP) Seasonal Chart

ABB Ltd. (NYSE:ABB) Seasonal Chart

Camden Property Trust (NYSE:CPT) Seasonal Chart

Avis Budget Group, Inc. (NASD:CAR) Seasonal Chart

Peyto Exploration & Development Corp. (TSE:PEY.TO) Seasonal Chart

NuVista Energy Ltd. (TSE:NVA.TO) Seasonal Chart
The Markets
Stocks closed modestly lower on Thursday as investors continue to monitor developments out of Ukraine. The S&P 500 Index slipped by four-tenths of one percent, remaining pinned below horizontal resistance at 4280. Support at the lows of the session was pegged at Wednesday’s upside open gap between 4170 and 4220. Momentum indicators on the daily chart continue to be pinned into the apex of triangle patterns as selling pressures continue to wane. This is a market that is experiencing difficulty attracting further investors that are willing to sell, despite the headline risks that remain overwhelming; hints of support around the February lows are starting to be realized. Things could always change based on the next headline that crosses the tape, but, at the present time, the market may have difficulty in the near-term moving substantially lower without some catalyst to get the bears reinvigorated.

Today, in our Market Outlook to subscribers, we discuss the following:
- The unexpected outperformance of transportation stocks
- Weekly Jobless Claims and the health of the labor market
- Natural gas inventories and the seasonal trade in the commodity
- US Consumer Price Index and what to look out for in the performance of stocks that benefit from inflationary pressures in the months ahead
Subscribe now and we’ll send this outlook to you.
Sentiment on Thursday, as gauged by the put-call ratio, ended close to neutral at 0.94.

Seasonal charts of companies reporting earnings today:

 Seasonal Chart")


S&P 500 Index


TSE Composite


| Sponsored By... |

|

