Stock Market Outlook for March 1, 2022

S&P 500 Index charts a rather indecisive doji candlestick just above support at 4280.
*** Stocks highlighted are for information purposes only and should not be considered as advice to purchase or to sell mentioned securities. As always, the use of technical and fundamental analysis is encouraged in order to fine tune entry and exit points to average seasonal trends.
Stocks Entering Period of Seasonal Strength Today:
Subscribers – Click on the relevant link to view the full profile. Not a subscriber? Signup here.

Exelon Corp. (NASD:EXC) Seasonal Chart

Quest Diagnostics Inc. (NYSE:DGX) Seasonal Chart

Nisource, Inc. (NYSE:NI) Seasonal Chart

Pepsico, Inc. (NASD:PEP) Seasonal Chart

Yum! Brands Inc. (NYSE:YUM) Seasonal Chart
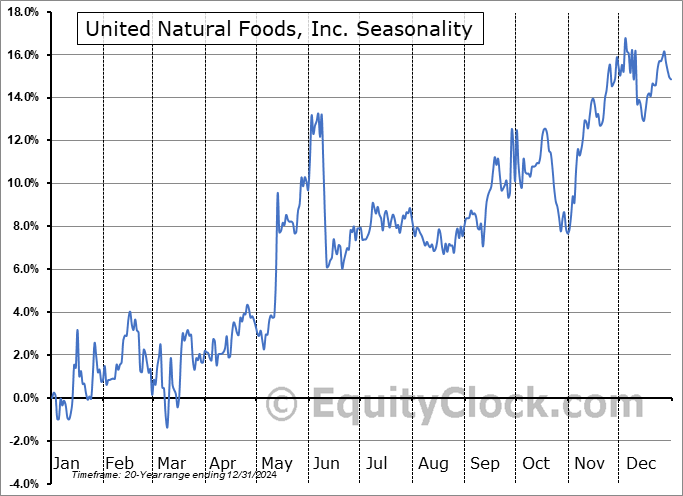
United Natural Foods, Inc. (NYSE:UNFI) Seasonal Chart
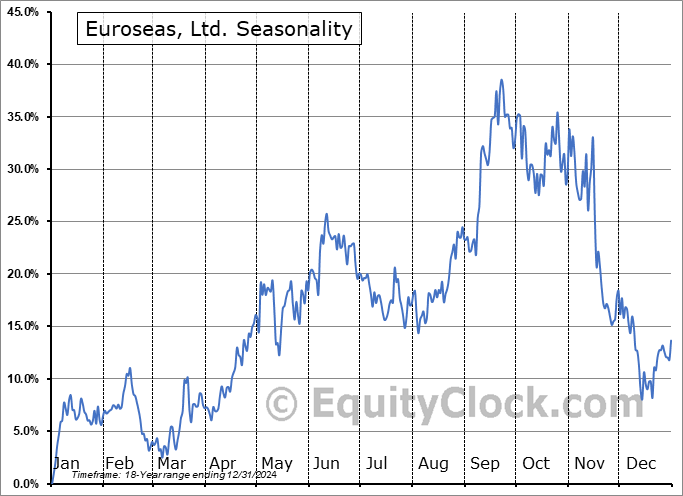
Euroseas, Ltd. (NASD:ESEA) Seasonal Chart

Healthcare Leaders Income ETF (TSE:HHL.TO) Seasonal Chart

Invesco DWA Utilities Momentum ETF (NASD:PUI) Seasonal Chart
The Markets
Stocks traded in a volatile manner in the last session of February as investors weighed the impact on the global economy of increasing sanctions against Russia. The S&P 500 Index closed lower by just less than a quarter of one percent, charting a rather indecisive doji candlestick above horizontal support at 4280. Momentum indicators continue to positively diverge from price, suggesting waning selling pressures, typically a precursor to a shift in the market trajectory. Major moving averages remain in positions of resistance, including the 20 and 200-day around 4450.

Today, in our Market Outlook to subscribers, we discuss the following:
- The level to shoot off of on the S&P 500 Index
- Double bottom support for small-caps and cryptocurrencies
- Equity market tendency for March
- Ratings changes in our weekly chart books: Find out what has been upgraded to Accumulate this week
Subscribe now and we’ll send this outlook to you.
The S&P 500 Index has gained an average of 1.0% in the month of March over the past 20 years with 60% of periods closing higher. Returns have ranged from a loss of 12.5% in March of 2020 to a gain of 8.5% in March of 2009. We provide more insight in our monthly report that was released to subscribers last week. The report is now available for download through the report archive listed on the home page of https://charts.equityclock.com/.


Want to know which areas of the market to buy or sell? Our Weekly Chart Books have just been updated, providing a clear Accumulate, Avoid, or Neutral rating for currencies, cryptocurrencies, commodities, broad markets, and subsectors/industries of the market. Subscribers can login and click on the relevant links to access.
Subscribe now.
You asked and we listened…
A new subscriber reached out to us looking for the inclusion of currency seasonality in our downloadable spreadsheet available to yearly subscribers. We are pleased to announce that we have expanded our offering of Forex seasonality, including a new downloadable spreadsheet for yearly subscribers highlighting the optimal holding periods for major currency crosses around the globe. New seasonal profiles for these crosses are available for viewing under the Forex heading of the chart database at https://charts.equityclock.com/category/forex and the Excel spreadsheet is available under Download tab at the top of the page.
Sentiment on Monday, as gauged by the put-call ratio, ended slightly bullish at 0.94.

Seasonal charts of companies reporting earnings today:


 Seasonal Chart")


 Seasonal Chart")


 Seasonal Chart")


S&P 500 Index


TSE Composite


| Sponsored By... |

|

