Stock Market Outlook for February 23, 2022

S&P 500 Index testing the neckline to a massive head-and-shoulders topping pattern.
*** Stocks highlighted are for information purposes only and should not be considered as advice to purchase or to sell mentioned securities. As always, the use of technical and fundamental analysis is encouraged in order to fine tune entry and exit points to average seasonal trends.
Stocks Entering Period of Seasonal Strength Today:
Subscribers – Click on the relevant link to view the full profile. Not a subscriber? Signup here.
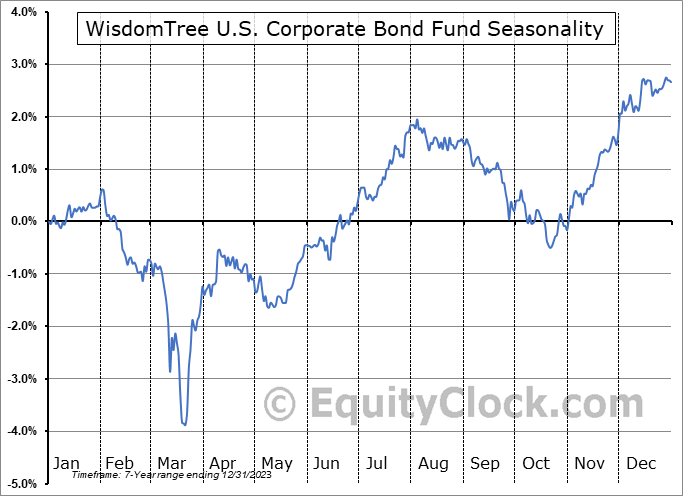
WisdomTree U.S. Corporate Bond Fund (AMEX:WFIG) Seasonal Chart

Meridian Mining Societas Europaea (TSXV:MNO.V) Seasonal Chart

Purpose Premium Yield Fund (TSE:PYF.TO) Seasonal Chart

Plantronics, Inc. (NYSE:POLY) Seasonal Chart

ATS Automation Tooling Systems, Inc. (TSE:ATA.to) Seasonal Chart

iShares Core Canadian Short Term Corporate + Maple Bond Index ETF (TSE:XSH.TO) Seasonal Chart

Sierra Wireless, Inc. (NASD:SWIR) Seasonal Chart

Waste Connections, Inc. (NYSE:WCN) Seasonal Chart

eHealth Inc. (NASD:EHTH) Seasonal Chart
The Markets
Stocks sold off on Tuesday as rising tensions between Russia and Ukraine sent a panic through the market. The S&P 500 Index closed lower by 1.01%, ending at the lowest level since October of last year. At the height of the selling pressures, horizontal support around 4280 was tested as the neckline to a head-and-shoulders topping pattern becomes increasingly defined. A significant breakdown from this juncture would forecast substantially lower values ahead with a calculated target of 3,780. This would be an extreme move, if realized, and account for a drop of 21.6% since the peak of the market of 4818.62 that was recorded on January 4th. We are not at that point yet to conclude that this is set to be the near-term target of the benchmark and it would take a close of at least 4,250 or less to suggest such an outcome. For now, the hurdle remains in a position of support, on a closing basis, and we will scrutinize the reaction to it carefully in the days ahead. Momentum indicators are still showing characteristics of a bearish trend, hovering predominantly below their middle lines. Despite the pullback in the market that we have been positioned for, there is still not enough to become enticed to take a stab in order to place our substantial cash hoard back to work after pulling down our equity exposure at the start of the year.

Today, in our Market Outlook to subscribers, we discuss the following:
- A review of our base-case for the path of the S&P 500 in the months ahead
- Watching the flows in this market to determine if a tradable low has been achieved
- Notable upgrades and downgrades in our weekly chart books: Find out what has been upgraded to Accumulate this week
- The trend of COVID cases in the US compared to the seasonal norm for respiratory illnesses
- Leisure/Entertainment stocks
Subscribe now and we’ll send this outlook to you.
Want to know which areas of the market to buy or sell? Our Weekly Chart Books have just been updated, providing a clear Accumulate, Avoid, or Neutral rating for currencies, cryptocurrencies, commodities, broad markets, and subsectors/industries of the market. Subscribers can login and click on the relevant links to access.
Subscribe now.
Sentiment on Tuesday, as gauged by the put-call ratio, ended neutral at 1.00.

Seasonal charts of companies reporting earnings today:


 Seasonal Chart")


S&P 500 Index


TSE Composite


| Sponsored By... |

|

