Stock Market Outlook for February 18, 2022

The Gold fund is breaking out as it continues to benefit from the volatility and uncertainty that are notorious of the market in the first couple of months of the year.
*** Stocks highlighted are for information purposes only and should not be considered as advice to purchase or to sell mentioned securities. As always, the use of technical and fundamental analysis is encouraged in order to fine tune entry and exit points to average seasonal trends.
Stocks Entering Period of Seasonal Strength Today:
Subscribers – Click on the relevant link to view the full profile. Not a subscriber? Signup here.

Campbell Soup Co. (NYSE:CPB) Seasonal Chart

MDU Resources Group, Inc. (NYSE:MDU) Seasonal Chart

Shenandoah Telecommunications Co. (NASD:SHEN) Seasonal Chart

Alibaba Group Holding Ltd. (NYSE:BABA) Seasonal Chart
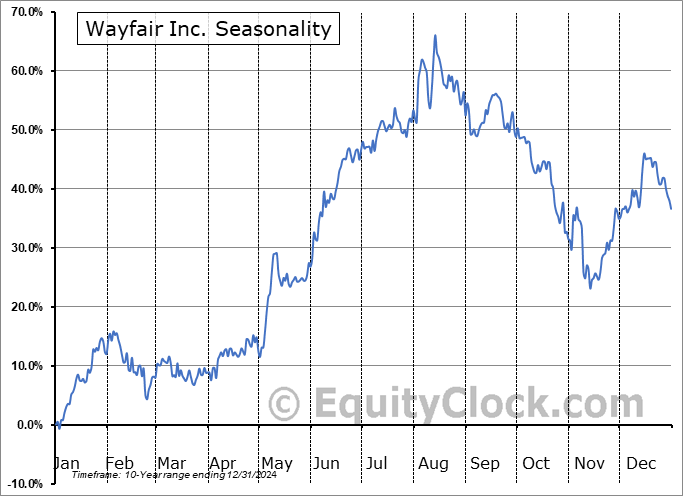
Wayfair Inc. (NYSE:W) Seasonal Chart

iShares Diversified Monthly Income ETF (TSE:XTR.TO) Seasonal Chart

iShares Emerging Markets Corporate Bond ETF (AMEX:CEMB) Seasonal Chart
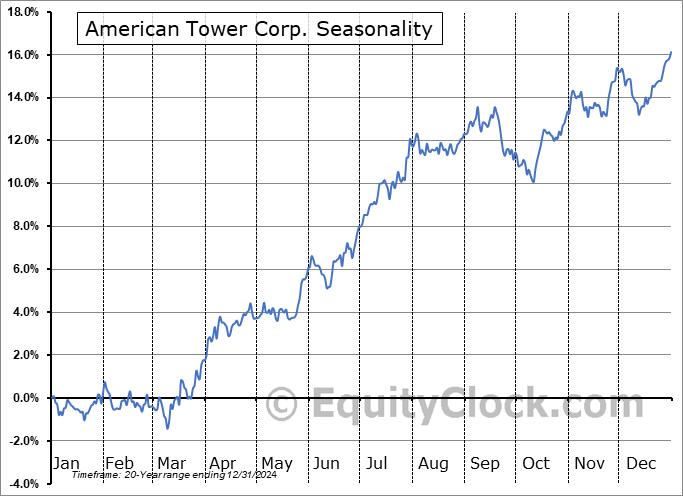
American Tower Corp. (NYSE:AMT) Seasonal Chart

George Weston Ltd. (TSE:WN.TO) Seasonal Chart

Crown Castle Intl Corp. (NYSE:CCI) Seasonal Chart

BMO Mid Federal Bond Index ETF (TSE:ZFM.TO) Seasonal Chart

AdvisorShares Ranger Equity Bear ETF (NYSE:HDGE) Seasonal Chart
The Markets
A classic risk-off day for markets as investors continue to express concern pertaining to the escalating tensions between Russia and Ukraine. The S&P 500 Index shed just over two percent, slicing back below the 20 and 200-day moving averages that had been flirted with in recent days. The benchmark is once again moving in on the lows charted in January just below 4300, also representing the neckline to a head-and-shoulders topping pattern. MACD has crossed back below its signal line following the oversold bounce recorded since the last week of January and characteristics of a bearish trend remain intact. As has been highlighted in recent reports, the backdrop to this market is certainly not enticing to hold a full allocation to risk. The simple fact that the large-cap benchmark is below its 200-day moving average is enough to justify caution on its our, but fundamental factors have spouted their own cautionary tale in recent days. The major hurdle for the large-cap benchmark on the downside is that aforementioned neckline support just below 4300, reaction to which will be heavily scrutinized. A definitive downside break would lead to a flood of selling pressures, but we don’t see that as a high likelihood in the near-term given the overwhelming bearish sentiment that has proliferated in the market in recent weeks. However, we are dealing with a catalyst (war with Russia) that doesn’t exactly fit into our seasonal models and we should be prepared for any outcome. We are open to any possibility and will sit with our significantly reduced equity allocation until a better opportunity to be aggressive in the market again returns.

Today, in our Market Outlook to subscribers, we discuss the following:
- Safe-havens catching a bid
- Gold breaking out
- Weekly Jobless Claims
- US Housing Starts and the stocks that are being influenced
- Manufacturer sentiment
Subscribe now and we’ll send this outlook to you.
Investor sentiment on Thursday, as gauged by the put-call ratio, ended slightly bearish at 1.04.

Seasonal charts of companies reporting earnings today:


S&P 500 Index


TSE Composite


| Sponsored By... |

|

