Stock Market Outlook for February 10, 2022

S&P/TSX 60 ETF breaking out of a multi-month consolidation range as resource centric stocks continue to attract attention.
*** Stocks highlighted are for information purposes only and should not be considered as advice to purchase or to sell mentioned securities. As always, the use of technical and fundamental analysis is encouraged in order to fine tune entry and exit points to average seasonal trends.
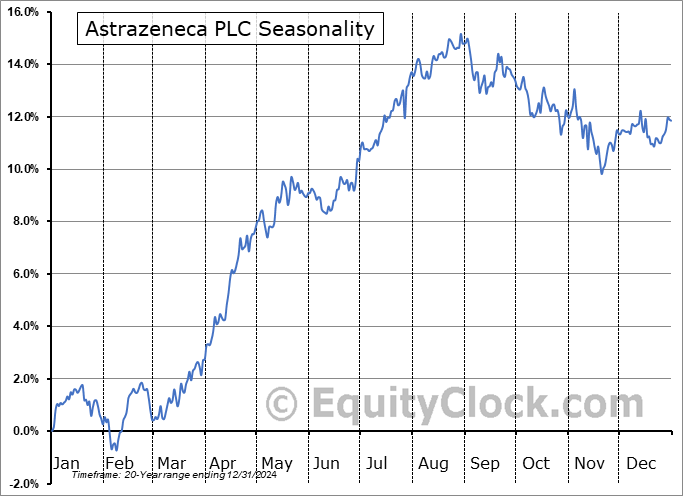
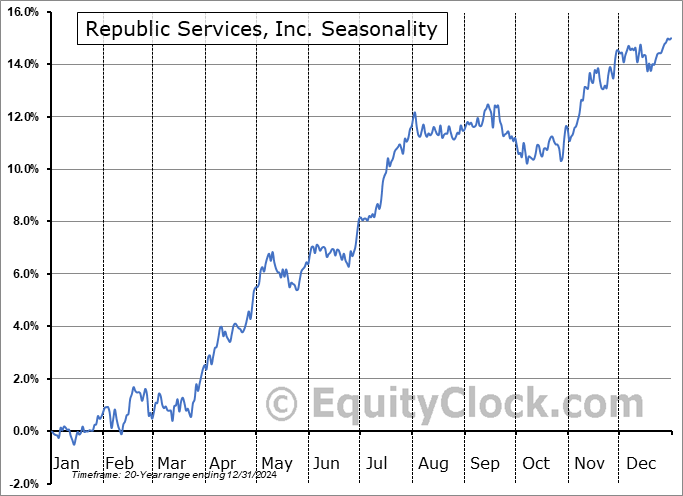
Stocks Entering Period of Seasonal Strength Today:
Subscribers – Click on the relevant link to view the full profile. Not a subscriber? Signup here.
Chemours Co. (NYSE:CC) Seasonal Chart
Yum China Holdings, Inc. (NYSE:YUMC) Seasonal Chart
Key Tronic Corp. (NASD:KTCC) Seasonal Chart
Vanguard FTSE All-World ex-US ETF (NYSE:VEU) Seasonal Chart
SPDR STOXX Europe 50 ETF (NYSE:SPEU) Seasonal Chart
SPDR S&P World ex-US ETF (AMEX:SPDW) Seasonal Chart
Schwab International Equity ETF (NYSE:SCHF) Seasonal Chart
WisdomTree International Hedged Quality Dividend Growth Fund (AMEX:IHDG) Seasonal Chart
SPDR MSCI ACWI ex-US ETF (NYSE:CWI) Seasonal Chart
Quanta Services, Inc. (NYSE:PWR) Seasonal Chart
Nordic American Tanker Shipping Ltd. (NYSE:NAT) Seasonal Chart
Quaker Chemical Corp. (NYSE:KWR) Seasonal Chart
Advantage Oil Gas Ltd. (TSE:AAV.TO) Seasonal Chart
Activision Blizzard Inc. (NASD:ATVI) Seasonal Chart
Teekay Tankers Ltd. (NYSE:TNK) Seasonal Chart
iShares MSCI EAFE ETF (NYSE:EFA) Seasonal Chart
Brookfield Asset Management Inc. (NYSE:BAM) Seasonal Chart
The Markets
Stocks rose strongly on Wednesday as investors continue to search for value in this market following January’s selloff. The S&P 500 Index gained 1.45%, moving back above short-term resistance at its 20-day moving average. The benchmark is back to where it was one week ago, just below 4600. Levels around the declining 50-day moving average are being tested as resistance. While the benchmark is likely to see a significant battle over the next 100-points or so, the upside gap at previous horizontal resistance at 4530 provides a level to shoot off of on the downside should buyers flip to sellers through the back half of February. Momentum indicators are still pointed higher and they continue to maintain characteristics of a bearish trend.
Today, in our Market Outlook to subscribers, we discuss the following:
- US Petroleum Status, the state of demand, and energy sector stocks
- US Wholesale Trade: What is driving activity and how to take advantage
- Watching the moves of other analysts/portfolio managers in the industry
- The breakout of the TSX 60 ETF
Subscribe now and we’ll send this outlook to you.
Sentiment on Wednesday, as gauged by the put-call ratio, ended slightly bullish at 0.89.
Seasonal charts of companies reporting earnings today:
S&P 500 Index
TSE Composite
| Sponsored By... |

|


