Stock Market Outlook for February 4, 2022

US Dollar Index continues to consolidate above support at 95, but it is the market’s reaction to the payroll report on Friday that will be telling of whether the longer-term rising trend will hold.
*** Stocks highlighted are for information purposes only and should not be considered as advice to purchase or to sell mentioned securities. As always, the use of technical and fundamental analysis is encouraged in order to fine tune entry and exit points to average seasonal trends.
Stocks Entering Period of Seasonal Strength Today:
Subscribers – Click on the relevant link to view the full profile. Not a subscriber? Signup here.

ION Geophysical Corp. (NYSE:IO) Seasonal Chart

Restaurant Brands International Inc. (TSE:QSR.TO) Seasonal Chart
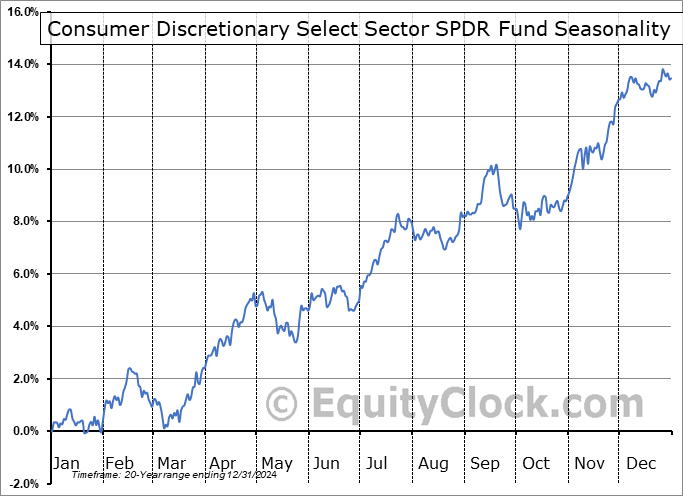
Consumer Discretionary Select Sector SPDR Fund (NYSE:XLY) Seasonal Chart

Equity Residential Property Trust (NYSE:EQR) Seasonal Chart

Williams Sonoma, Inc. (NYSE:WSM) Seasonal Chart
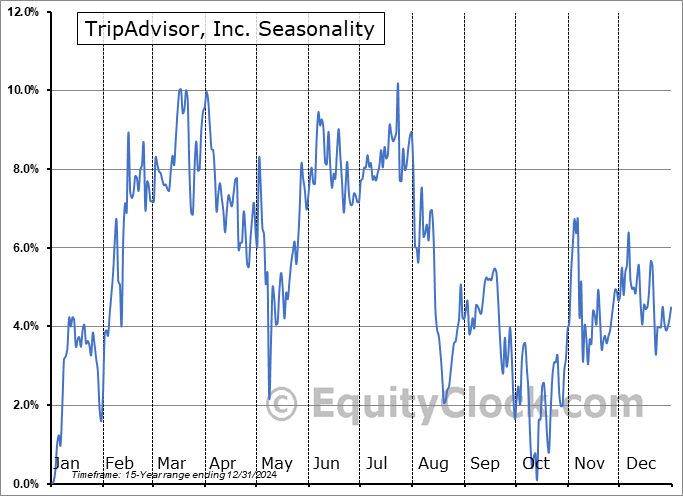
TripAdvisor, Inc. (NASD:TRIP) Seasonal Chart

Innospec, Inc. (NASD:IOSP) Seasonal Chart

Steven Madden, Ltd. (NASD:SHOO) Seasonal Chart

Arista Networks, Inc. (NYSE:ANET) Seasonal Chart
The Markets
Stocks sold off on Thursday as a shocking plunge in shares of Meta Platforms (Facebook – FB) added renewed selling pressures to the formerly loved growth trade. The S&P 500 Index ended down by 2.44%, closing back below the 100-day moving average that was broken in the prior session. Momentum indicators are rolling over again, continuing the trend of lower-lows and lower-highs that has been in place since November. Characteristics of a bearish trend remain intact. So far, our target of the rebound rally in the 4600 zone is sticking, but while we did rotate our portfolio yesterday to significantly reduce our exposure to technology/growth, we are not quite ready to retrench from our ramped up equity exposure enacted last week on Monday and Tuesday. The gains accumulated in this trade in such a short period of time (now approximately 4% to 5%) has given us a healthy buffer, but we do acknowledge that the near-term path is highly uncertain, unlike the turning points from the past month (bearish on January 5th then bullish on January 24th/25th) that were easier to make an aggressive and decisive change in the portfolio. Thursday’s downfall in the equity market opened a gap between 4535 and 4580, which could prove to be a zone that investors will desire to sell into. Should we see that the market is more willing to once again respect levels of resistance and ignore levels of support, this would be the more likely catalyst to adjust our equity allocation in our Super Simple Seasonal Portfolio again.

Today, in our Market Outlook to subscribers, we discuss the following:
- Weekly Jobless claims and the state of the labor market
- A look at what to expect of January’s payroll report
- US Dollar Index
- Natural Gas Inventories and what the fundamental backdrop says about an investment in the commodity
- US Factory Orders
- Investor Sentiment
Subscribe now and we’ll send this outlook to you.
Sentiment on Thursday, as gauged by the put-call ratio, ended bearish at 1.09.

Seasonal charts of companies reporting earnings today:


S&P 500 Index


TSE Composite


| Sponsored By... |

|

