Stock Market Outlook for January 26, 2022

Leading indicators of the health of the economy remain in good shape.
Â
Â
Â
*** Stocks highlighted are for information purposes only and should not be considered as advice to purchase or to sell mentioned securities.  As always, the use of technical and fundamental analysis is encouraged in order to fine tune entry and exit points to average seasonal trends.
Stocks Entering Period of Seasonal Strength Today:
Subscribers – Click on the relevant link to view the full profile. Not a subscriber? Signup here.
Eastman Chemical Co. (NYSE:EMN) Seasonal Chart
CONMED Corp. (NYSE:CNMD) Seasonal Chart
Pzena Investment Management Inc. (NYSE:PZN) Seasonal Chart
Invesco Russell 1000 Equal Weight ETF (AMEX:EQAL) Seasonal Chart
Virtus Global Multi-Sector Income Fund (NYSE:VGI) Seasonal Chart
e.l.f. Beauty, Inc. (NYSE:ELF) Seasonal Chart
Â
Â
Â
The Markets
The rocky trading in the market continues as investors attempt to peg a low following the dramatic selloff in stocks that has been recorded in recent weeks. The S&P 500 Index closed down by 1.22%, once again ending well off of the lows of the session that saw a decline of nearly 3% early in the day. The extreme gyrations continue to be realized below the recently broken 200-day moving average, a critical hurdle for long-term investors. With the Fed set to provide their latest policy statement today (Wednesday), the catalyst is in place to either confirm this hurdle as resistance or break the market out of this rut that it has been in since the year started. The benchmark is currently showing a loss of 8.6% for the month of January and a close at this level by the end of the month would amount to the weakest first month of the year performance on record. It would be very difficult to sustain this degree of negativity through month-end and into the start of the next without some catalyst. Upside target of any rebound attempt on the market benchmark is towards previous support, now resistance, at 4530. The now declining 100-day moving average, which supported the benchmark previously, has yet to be tested as resistance. The first move lower in the equity market is never a good indication of the health of the market, but rather the extent of the rebound that really portrays the strains and whether the trajectory of the benchmark has indeed shifted. We have yet to experience this rebound move, but we are ready for it, whether it merely carries us through the next few days or the next few months.
Today, in our Market Outlook to subscribers, we discuss the following:
- Hourly look at the large-cap benchmark and the targets that we have our eye on
- Home Prices in the US and the leading indication for the economy and stocks
- Shipping activity, the state of demand, and the leading implications for stocks
- The period of seasonal strength for transportation stocks
Subscribe now and we’ll send this outlook to you.
Sentiment on Tuesday, as gauged by the put-call ratio, ended bullish at 0.88.
Â
Â
Â
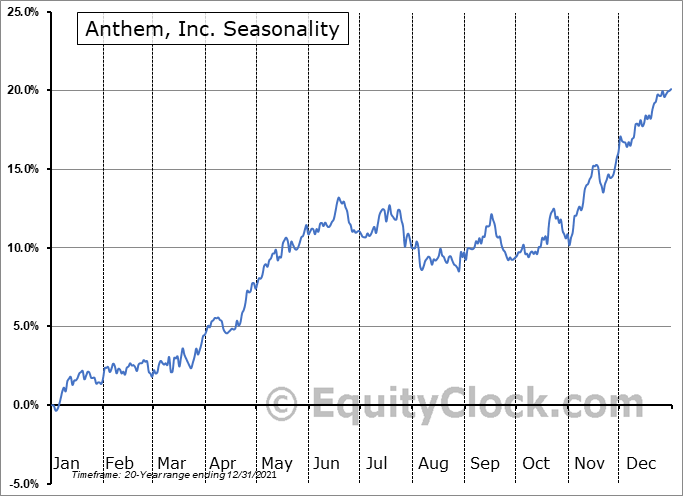
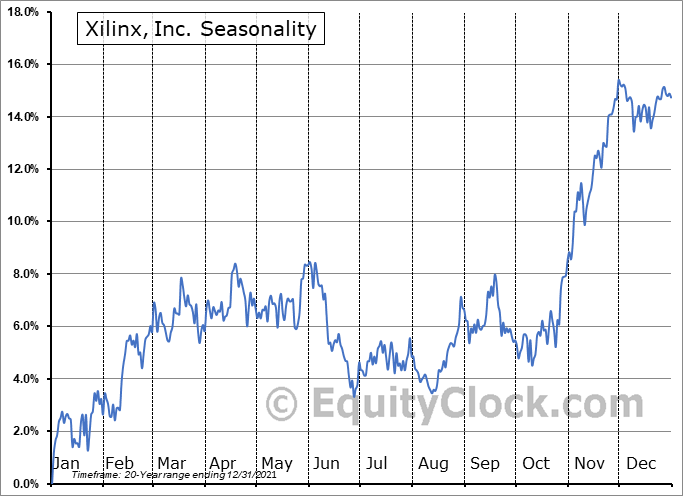
Seasonal charts of companies reporting earnings today:
Â
Â
S&P 500 Index
Â
Â
TSE Composite
| Sponsored By... |

|


