Stock Market Outlook for January 24, 2022

The highest put-call ratio since March of 2020 suggests that investors are aggressively hedged against further equity market losses.
Â
Â
Â
*** Stocks highlighted are for information purposes only and should not be considered as advice to purchase or to sell mentioned securities.  As always, the use of technical and fundamental analysis is encouraged in order to fine tune entry and exit points to average seasonal trends.
Stocks Entering Period of Seasonal Strength Today:
Subscribers – Click on the relevant link to view the full profile. Not a subscriber? Signup here.

Flowserve Corp. (NYSE:FLS) Seasonal Chart
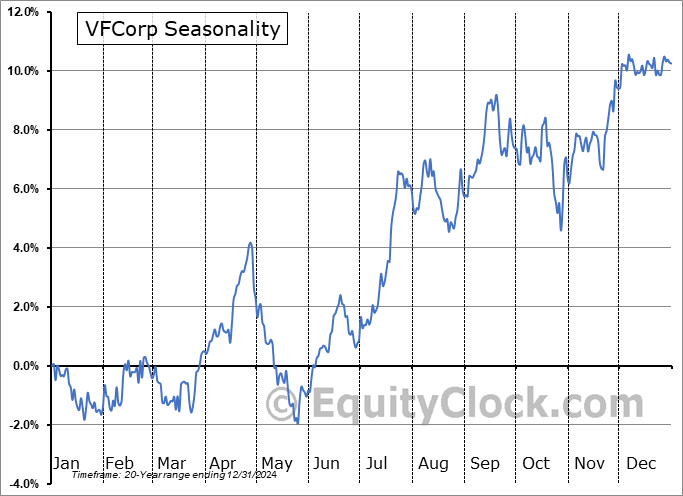
VFCorp (NYSE:VFC) Seasonal Chart

Stella-Jones, Inc. (TSE:SJ.TO) Seasonal Chart

Idex Corp. (NYSE:IEX) Seasonal Chart

Central Garden & Pet Co. (NASD:CENTA) Seasonal Chart

Tapestry, Inc. (NYSE:TPR) Seasonal Chart

Crane Co. (NYSE:CR) Seasonal Chart

VeriSign, Inc. (NASD:VRSN) Seasonal Chart

Haynes International Inc. (NASD:HAYN) Seasonal Chart

Teekay Corp. (NYSE:TK) Seasonal Chart
Â
Â
The Markets
Stocks slipped for a fourth straight session as a concerning forecast from Netflix once again had investors taking down risk in portfolios. The S&P 500 Index fell by nearly two percent, intersecting with its 200-day moving average for the fist time since June of 2020. Momentum indicators remain on the decline with the Relative Strength Index (RSI) slipping into oversold territory below 30. The 50-day moving average is in a position of resistance overhead around 4666, which is now over 250-points above present levels, the furthest the benchmark has been below this hurdle since the first half of April of 2020. The market is reaching some oversold extremes here and we are getting excited to put our cash hoard set aside at the start of the year back to work. The digestion in the equity market to start the year has played out as expected, although the magnitude of the decline in a short order certainly was a pleasant surprise. This will allow us to take advantage of these depressed prices to play what is still a market that is showing a longer-term trend of higher-highs and higher-lows.

Today, in our Market Outlook to subscribers, we discuss the following:
- Weekly look at the large-cap benchmark and the prudent course of action
- Looking for signs of capitulation
- The rise in the Volatility Index (VIX) and the signal to know when to buy stocks
- The change being enacted in the Super Simple Seasonal Portfolio
- US Petroleum Inventories, the state of demand, and what they have to say about the macro fundamental backdrop of the economy
- Canadian Retail Sales and the path of activity expected through the year ahead
- Investor sentiment
Subscribe now and we’ll send this outlook to you.
Sentiment on Friday, as gauged by the put-call ratio, ended overly bearish at 1.33.

Â
Â
Â
Seasonal charts of companies reporting earnings today:


Â
Â
S&P 500 Index


Â
Â
TSE Composite


| Sponsored By... |

|

