Stock Market Outlook for January 21, 2022

Concerns pertaining to the labor market and the manufacturing economy have been alleviated, for now, based on reports released on Thursday.
Â
Â
Â
*** Stocks highlighted are for information purposes only and should not be considered as advice to purchase or to sell mentioned securities.  As always, the use of technical and fundamental analysis is encouraged in order to fine tune entry and exit points to average seasonal trends.
Stocks Entering Period of Seasonal Strength Today:
Subscribers – Click on the relevant link to view the full profile. Not a subscriber? Signup here.

CSX Corp. (NASD:CSX) Seasonal Chart

CNX Resources Corp. (NYSE:CNX) Seasonal Chart

Canadian National Railway Co. (TSE:CNR.TO) Seasonal Chart

PVH Corp. (NYSE:PVH) Seasonal Chart
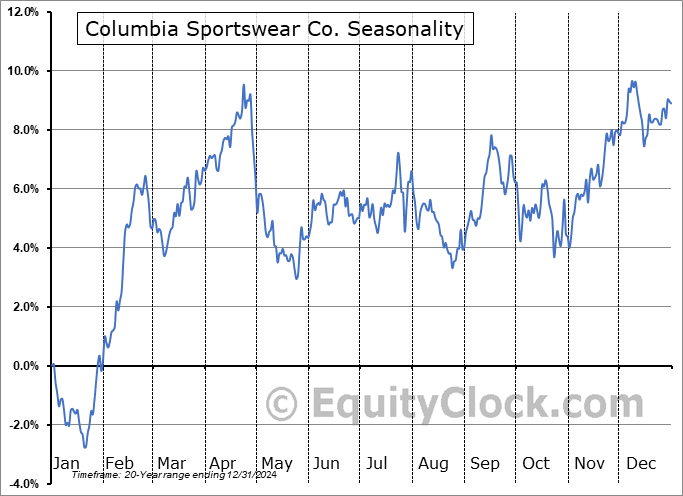
Columbia Sportswear Co. (NASD:COLM) Seasonal Chart

SPDR SSGA US Large Cap Low Volatility Index ETF (AMEX:LGLV) Seasonal Chart

Stanley Black & Decker Inc. (NYSE:SWK) Seasonal Chart

iShares MSCI BRIC ETF (NYSE:BKF) Seasonal Chart

Invesco DB Commodity Index Tracking Fund (NYSE:DBC) Seasonal Chart
Â
Â
The Markets
Stocks dipped for a third straight session as investors sold into early day strength. The S&P 500 Index ended the day lower by 1.10%, making further progress below support at its 100-day moving average. The next big variable hurdle can be seen at the 200-day moving average, now at 4427, a logical level for long-term investors to become re-enticed. Momentum indicators continue to point lower and the Relative Strength Index (RSI) is quickly reaching oversold territory at 30. From this juncture, it is reasonable to expect an oversold low to materialize in the days ahead that will allow us to become reinvigorated in stocks for the uptick in prices that is typically realized into the start of the new month. Stay tuned for changes in our Super Simple Seasonal Portfolio when it becomes apparent that selling capitulation has been realized.

Today, in our Market Outlook to subscribers, we discuss the following:
- The ongoing evolution of the head-and-shoulders topping pattern on the S&P 500 Index
- The Invesco QQQ Trust (QQQ) and the target implied from this week’s breakdown from a trading range
- Weekly Jobless Claims and the health of the labor market
- Philadelphia Fed Index
- US Existing Home Sales
Subscribe now and we’ll send this outlook to you.
Sentiment on Thursday, as gauged by the put-call ratio, ended neutral at 0.99.

Â
Â
Â
Seasonal charts of companies reporting earnings today:


Â
Â
S&P 500 Index


Â
Â
TSE Composite


| Sponsored By... |

|

