Stock Market Outlook for January 7, 2022

While the S&P 500 Equally Weighted Index is not immune to January volatility, a trend of outperformance has become apparent versus its capitalization weighted counterpart as positive seasonal tendencies materialize.
Â
Â
Â
*** Stocks highlighted are for information purposes only and should not be considered as advice to purchase or to sell mentioned securities.  As always, the use of technical and fundamental analysis is encouraged in order to fine tune entry and exit points to average seasonal trends.
Stocks Entering Period of Seasonal Strength Today:
Subscribers – Click on the relevant link to view the full profile. Not a subscriber? Signup here.
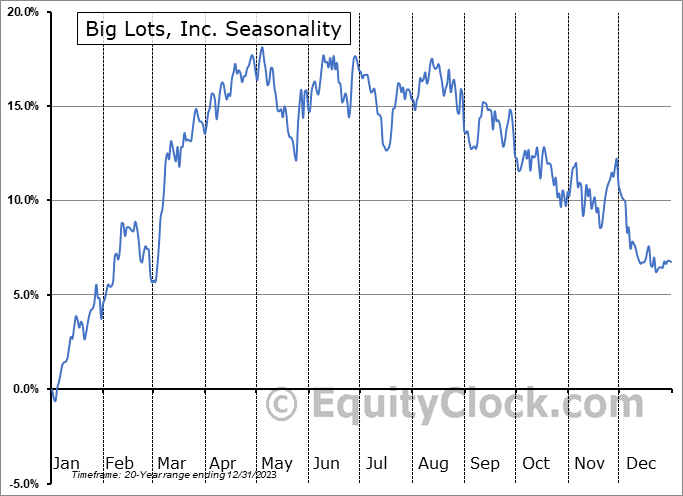
Big Lots, Inc. (NYSE:BIG) Seasonal Chart

Union Pacific Corp. (NYSE:UNP) Seasonal Chart

Alliant Energy Corp. (NASD:LNT) Seasonal Chart

Haemonetics Corp. (NYSE:HAE) Seasonal Chart

K12 Inc. (NYSE:LRN) Seasonal Chart
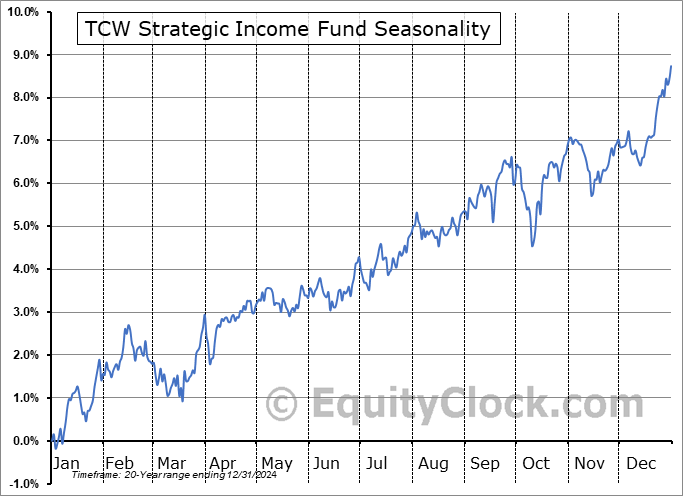
TCW Strategic Income Fund (NYSE:TSI) Seasonal Chart

First Trust ISE Water Index Fund (NYSE:FIW) Seasonal Chart

iShares MSCI China ETF (NASD:MCHI) Seasonal Chart

Netflix, Inc. (NASD:NFLX) Seasonal Chart

Microchip Technology Inc. (NASD:MCHP) Seasonal Chart

Tootsie Roll Industries (NYSE:TR) Seasonal Chart

Africa Oil Corp. (TSE:AOI.TO) Seasonal Chart

Sandstorm Gold Ltd. (TSE:SSL.TO) Seasonal Chart

Watsco, Inc. (NYSE:WSO) Seasonal Chart

iShares MSCI Emerging Markets Asia ETF (NASD:EEMA) Seasonal Chart

Invesco S&P International Developed Low Volatility ETF (AMEX:IDLV) Seasonal Chart

iShares S&P Mid-Cap 400 Growth ETF (NYSE:IJK) Seasonal Chart

Vanguard Total International Stock ETF (NASD:VXUS) Seasonal Chart
Â
Â
The Markets
Stocks closed mixed ahead of payroll report Friday as strength in energy and financials offset weakness in materials, utilities, technology, and health care. The S&P 500 Index shed a tenth of a percent on the session, showing difficulty clawing back the loss that was recorded in the prior session. Support at the rising 50-day moving average was tested at the lows of the session, keeping the rising intermediate-term trend intact, for now, while the previous breakout point to December’s Santa Claus rally at 4720 is in a position of resistance. MACD has triggered a new sell signal by crossing below its signal line, confirming a negative divergence of this indicator compared to price, a sign of waning buying demand. For the time-being, December’s move above resistance at 4720 is looking like it could be a false breakout, which, if true, would be concerning for the intermediate-term trend.

Today, in our Market Outlook to subscribers, we discuss the following:
- The outperformance of the equally weighted S&P 500 Index
- Weekly Jobless Claims and the health of the labor market
- A preview of what to expect of December’s Non-Farm Payroll report
- Watching the US Dollar
- The fundamental backdrop of Natural Gas
- US Factory Orders
Subscribe now and we’ll send this outlook to you.
Sentiment on Thursday, as gauged by the put-call ratio, ended neutral at 0.95.

Â
Â
Seasonal charts of companies reporting earnings today:

 Seasonal Chart")
Â
Â
S&P 500 Index


Â
Â
TSE Composite


| Sponsored By... |

|

