Stock Market Outlook for December 22, 2021

Reopening plays snap-back as we prepare for the Santa Claus rally.
Â
Â
Â
*** Stocks highlighted are for information purposes only and should not be considered as advice to purchase or to sell mentioned securities.  As always, the use of technical and fundamental analysis is encouraged in order to fine tune entry and exit points to average seasonal trends.
Stocks Entering Period of Seasonal Strength Today:
Subscribers – Click on the relevant link to view the full profile. Not a subscriber? Signup here.
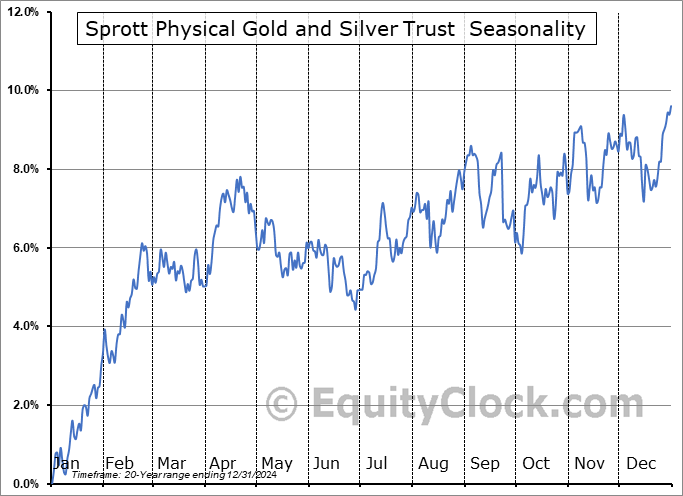
Sprott Physical Gold and Silver Trust (AMEX:CEF) Seasonal Chart

iShares S&P/TSX Capped Energy Index ETF (TSE:XEG.to) Seasonal Chart

Henry Schein, Inc. (NASD:HSIC) Seasonal Chart

Dream Office Real Estate Investment Trust (TSE:D/UN.TO) Seasonal Chart

Mag Silver Corp. (TSE:MAG.TO) Seasonal Chart

Endeavour Silver Corp. (TSE:EDR.TO) Seasonal Chart

iShares MSCI Kokusai ETF (NYSE:TOK) Seasonal Chart

McEwen Mining Inc. (NYSE:MUX) Seasonal Chart

Neptune Technologies & Bioressources Inc. (TSE:NEPT.TO) Seasonal Chart
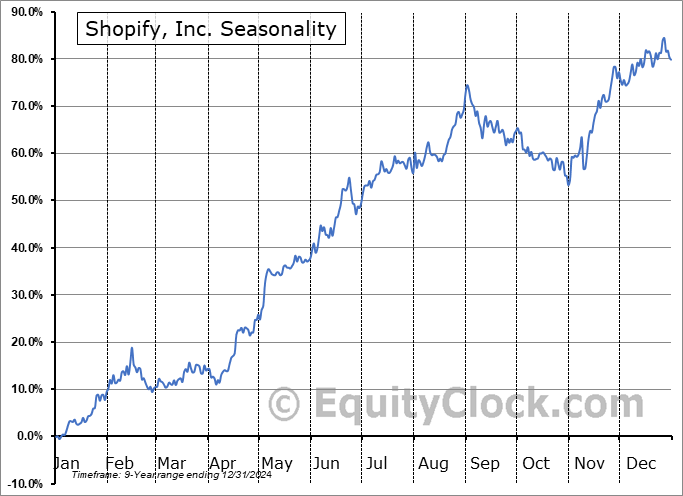
Shopify, Inc. (NYSE:SHOP) Seasonal Chart

iShares MSCI EAFE Small-Cap ETF (NASD:SCZ) Seasonal Chart

SPDR S&P Emerging Markets ETF (AMEX:SPEM) Seasonal Chart

Sony Group Corporation (NYSE:SONY) Seasonal Chart
Â
Â
The Markets
Stocks rebounded on Tuesday, erasing the prior session’s decline, as investors digested comments from President Biden, who indicated that we are not heading towards a winter of 2020 situation in which widespread shutdowns crippled the economy. Reopening plays that had been severely punished in recent days, such as airlines, gambling, and recreational services, snapped back sharply as negative bets unwound. The Dow Jones Recreational Services Index, which includes cruise lines, movie theaters, and theme parks, has moved back into the downside open gap that was charted in the post-Thanksgiving session when we learned of the threat of this new COVID variant. The reopening segments of the market had become tremendously oversold in recent weeks and were prone to a snap-back upon any alleviation of the negative news flow that has been persistent for weeks. The next move for these burdened bets will be critical to determine if Tuesday’s move was merely a snap-back or something sustainable. For the Recreational Services industry benchmark, resistance around 100 would have to be surpassed in order to hint that it has further legs to excel. Seasonally, the Recreational Services sees its optimal holding period in the summer between July 16th and October 24th.

 Arithmetic Average Seasonal Chart")
The S&P 500 Index gained 1.78% on the session, led by core-cyclical groups of energy, discretionary, financials, industrials, and materials. The benchmark has retaken levels above its 50-day moving average and closed around its declining 20-day moving average, a short-term hurdle that is in a position of resistance. Momentum indicators are still pointed lower, negatively diverging from the double-top resistance around 4700 that is readily apparent on the chart. The intermediate-term trend remains under threat.

Today, in our Market Outlook for subscribers, we discuss the following:
- Our plan and what we desire to target for the Santa Claus rally ahead
- Hourly look at the large-cap benchmark
- US Shipping activity and demand
- Canada Retail Sales and what is driving activity
Subscribe now and we’ll send this outlook to you.
Sentiment on Tuesday, as gauged by the put-call ratio, ended bullish at 0.86.

Â
Â
Â
Seasonal charts of companies reporting earnings today:


Â
Â
S&P 500 Index


Â
Â
TSE Composite


| Sponsored By... |

|

