Stock Market Outlook for December 21, 2021

The bulls are losing their grip.
Â
Â
Â
*** Stocks highlighted are for information purposes only and should not be considered as advice to purchase or to sell mentioned securities.  As always, the use of technical and fundamental analysis is encouraged in order to fine tune entry and exit points to average seasonal trends.
Stocks Entering Period of Seasonal Strength Today:
Subscribers – Click on the relevant link to view the full profile. Not a subscriber? Signup here.

Transcontinental Inc. (TSE:TCL/A.TO) Seasonal Chart

Avalon Advanced Materials, Inc. (TSE:AVL.TO) Seasonal Chart

Plug Power, Inc. (NASD:PLUG) Seasonal Chart

Suncor Energy, Inc. (NYSE:SU) Seasonal Chart

Invesco China Technology ETF (NYSE:CQQQ) Seasonal Chart

iShares MSCI Japan ETF (NYSE:EWJ) Seasonal Chart
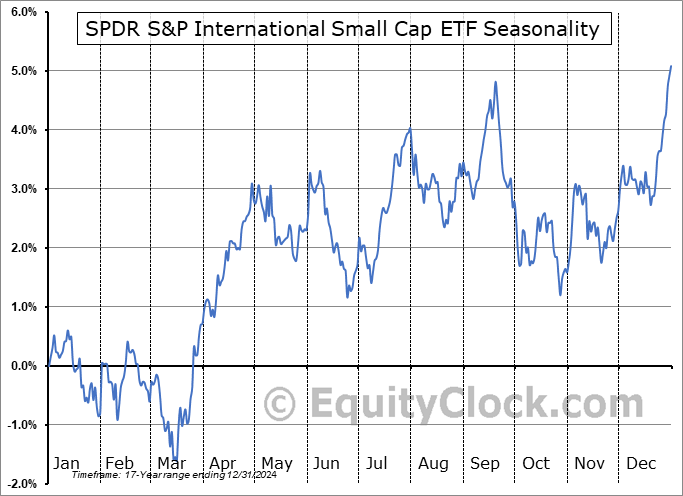
SPDR S&P International Small Cap ETF (NYSE:GWX) Seasonal Chart

Global X Robotics & Artificial Intelligence Thematic ETF (NASD:BOTZ) Seasonal Chart
Â
Â
The Markets
Stocks dipped on Monday as Omicron concerns continue to grip the market. The S&P 500 index closed down by 1.14%, closing below early December’s upside gap between 4615 and 4635 that we had been monitoring closely in recent weeks. The benchmark gapped below its rising 50-day moving average, elevating the threat to the intermediate-term trend as the prospect of a double-top just above 4700 becomes real. The topping pattern would project a theoretical downside target to 4275 should support at the December low of 4495 break. The benchmark tested the rising 100-day moving average at the lows of the session, a hurdle that was last tested on December 3rd. Momentum indicators continue to trend lower as investors peel back risk amidst the evolving threat of the virus.

Today, in our Market Outlook for subscribers, we discuss the following:
- The change in allocation in the Super Simple Seasonal Portfolio
- The bulls losing their grip in the market
- The signs of optimism during Monday’s carnage
- Notable changes in this week’s chart books
Subscribe now and we’ll send this outlook to you.
Want to know which areas of the market to buy or sell? Our Weekly Chart Books have just been updated, providing a clear Accumulate, Avoid, or Neutral rating for currencies, cryptocurrencies, commodities, broad markets, and subsectors/industries of the market. Subscribers can login and click on the relevant links to access.
Subscribe now.
Sentiment on Monday, as gauged by the put-call ratio, ended bullish at 0.84.

Â
Â
Â
Â
Seasonal charts of companies reporting earnings today:


Â
Â
S&P 500 Index


Â
Â
TSE Composite


| Sponsored By... |

|

