Stock Market Outlook for December 16, 2021

The defensive bias that is proliferating in this market suggests caution remains warranted.
Â
Â
Â
*** Stocks highlighted are for information purposes only and should not be considered as advice to purchase or to sell mentioned securities.  As always, the use of technical and fundamental analysis is encouraged in order to fine tune entry and exit points to average seasonal trends.
Stocks Entering Period of Seasonal Strength Today:
Subscribers – Click on the relevant link to view the full profile. Not a subscriber? Signup here.

Royal Bank of Canada (TSE:RY.TO) Seasonal Chart

Papa Johns Intl, Inc. (NASD:PZZA) Seasonal Chart

H&R Real Estate Investment Trust (TSE:HR/UN.TO) Seasonal Chart

Lithium Americas Corp. (TSE:LAC.TO) Seasonal Chart

Cheniere Energy, Inc. (AMEX:LNG) Seasonal Chart

CAI International Inc. (NYSE:CAI) Seasonal Chart

Global X NASDAQ China Technology ETF (AMEX:CHIC) Seasonal Chart

iShares MSCI ACWI Low Carbon Target ETF (AMEX:CRBN) Seasonal Chart

ROBO Global Robotics and Automation Index ETF (AMEX:ROBO) Seasonal Chart
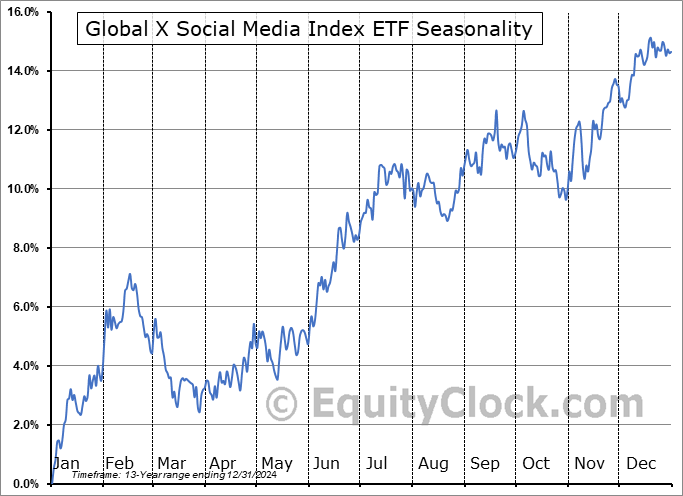
Global X Social Media Index ETF (NASD:SOCL) Seasonal Chart
Â
Â
Â
The Markets
Stocks rallied on Wednesday as the Fed did what it could to avoid rattling the market by advancing the taper timeline, as expected. The S&P 500 Index gained 1.63%, moving above the downside open gap that was charted on Tuesday and retaking levels back above the 20-day moving average. The benchmark is back to horizontal resistance just above 4700, knocking on the door of all-time highs that the market has been battling with for a month and a half. Intermediate support at the 50-day moving average remains intact at 4593.

Today, in our Market Outlook to subscribers, we discuss the following:
- An hourly look at the large-cap benchmark, the levels of significance, and the prudent course of action for portfolios
- Introducing the Super Simple Seasonal Portfolio, highlighting allocations by Asset Class
- US Retail Sales and stocks in the retail industry
- Manufacturer sentiment
- Cracks developing on the chart of Copper
- Outperformance of defensive sectors
Subscribe now and we’ll send this outlook to you.
Sentiment on Wednesday, as gauged by the put-call ratio, ended close to neutral at 0.93.

Â
Â
Â
Â
Â
Seasonal charts of companies reporting earnings today:


Â
Â
S&P 500 Index


Â
Â
TSE Composite


| Sponsored By... |

|

