Stock Market Outlook for December 7, 2021

Bitcoin is pressuring long-term rising trendline support, a level that warrants scrutiny to assure that the prospect of a double-top below $65,000 does not materialize.
*** Stocks highlighted are for information purposes only and should not be considered as advice to purchase or to sell mentioned securities. As always, the use of technical and fundamental analysis is encouraged in order to fine tune entry and exit points to average seasonal trends.
Stocks Entering Period of Seasonal Strength Today:
Subscribers – Click on the relevant link to view the full profile. Not a subscriber? Signup here.
Quebecor, Inc. (TSE:QBR/B.TO) Seasonal Chart
Precision Drilling Corp. (TSE:PD.TO) Seasonal Chart
Nabors Industries, Inc. (NYSE:NBR) Seasonal Chart
Range Resources Corp. (NYSE:RRC) Seasonal Chart
Brookfield Renewable Energy Partners LP (TSE:BEP/UN.TO) Seasonal Chart
iShares Core S&P/TSX Composite High Dividend Index ETF (TSE:XEI.TO) Seasonal Chart
Invesco DB Agriculture Fund (NYSE:DBA) Seasonal Chart
VanEck Vectors Israel ETF (AMEX:ISRA) Seasonal Chart
The Markets
Stocks snapped back on Monday as investors stepped in to pick up some of the beaten down names following the Omicron selloff over the past week. The S&P 500 Index gained 1.17%, turning higher from support at its 50-day moving average. Stochastics are showing indications of “hooking†higher from oversold levels achieved through the end of last year, triggering a renewed buy signal for the market benchmark. MACD is also showing signs of trying to curl higher around the mid-point to its range, attempting to recoup the bullish characteristics that has been seen for much of the year. As has been emphasized in our writing, it is not the initial plunge in stocks that warrants scrutinizing, but rather the strength of the rebound. The market looks poised to attempt this rebound and the height of the bounce is what we will be scrutinizing. Any signs of resistance at or below the previous peak around 4750 may warrant defensive measures. Intermediate to long-term trends are still deemed to be positive.
Today, in our Market Outlook to subscribers, we discuss the following:
- A re-look at the hourly chart of the large-cap benchmark and the end-of-year portfolio rebalance period
- Moves in Monday’s session to be enticed by and what we’re doing
- Notable upgrades and downgrades in this week’s chart books
- Forestry stocks
- Bitcoin on our watchlist
- Investor sentiment
Subscribe now and we’ll send this outlook to you.
Want to know which areas of the market to buy or sell? Our Weekly Chart Books have just been updated, providing a clear Accumulate, Avoid, or Neutral rating for currencies, cryptocurrencies, commodities, broad markets, and subsectors/industries of the market. Subscribers can login and click on the relevant links to access.
Subscribe now.
Sentiment on Monday, as gauged by the put-call ratio, ended bearish at 1.01.
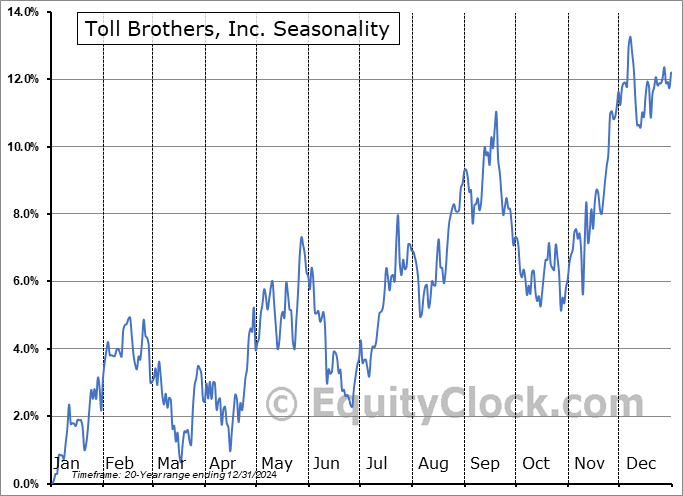
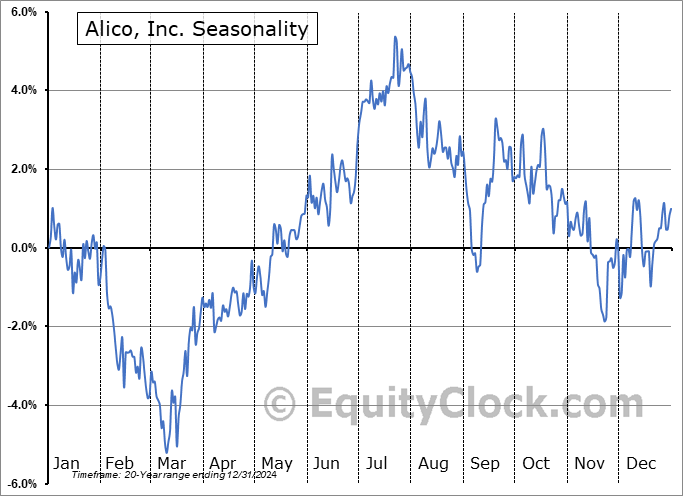
Seasonal charts of companies reporting earnings today:
S&P 500 Index
TSE Composite
| Sponsored By... |

|


