Stock Market Outlook for December 6, 2021

Risk aversion leaching into the market as bond ETFs break above a double-bottom pattern.
Â
Â
*** Stocks highlighted are for information purposes only and should not be considered as advice to purchase or to sell mentioned securities.  As always, the use of technical and fundamental analysis is encouraged in order to fine tune entry and exit points to average seasonal trends.
Stocks Entering Period of Seasonal Strength Today:
Subscribers – Click on the relevant link to view the full profile. Not a subscriber? Signup here.

Weyerhaeuser Co. (NYSE:WY) Seasonal Chart

Altria Group Inc. (NYSE:MO) Seasonal Chart

Major Drilling Group Intl, Inc. (TSE:MDI.TO) Seasonal Chart

Edwards Lifesciences Corp. (NYSE:EW) Seasonal Chart

Rogers Sugar Inc. (TSE:RSI.TO) Seasonal Chart

Morgan Stanley Emerging Markets Debt Fund Inc. (NYSE:MSD) Seasonal Chart
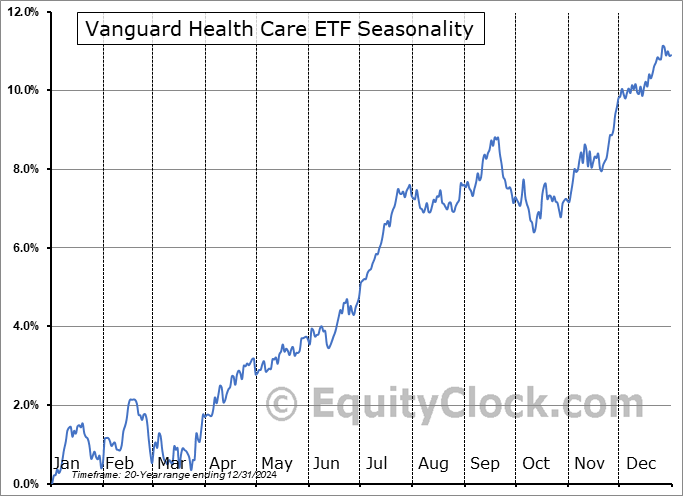
Vanguard Health Care ETF (NYSE:VHT) Seasonal Chart

Hershey Foods Corp. (NYSE:HSY) Seasonal Chart

BCE, Inc. (TSE:BCE.TO) Seasonal Chart

Sherritt Intl Corp. (TSE:S.TO) Seasonal Chart

Canadian Utilities Ltd. (TSE:CU.TO) Seasonal Chart

AltaGas Income Ltd. (TSE:ALA.TO) Seasonal Chart
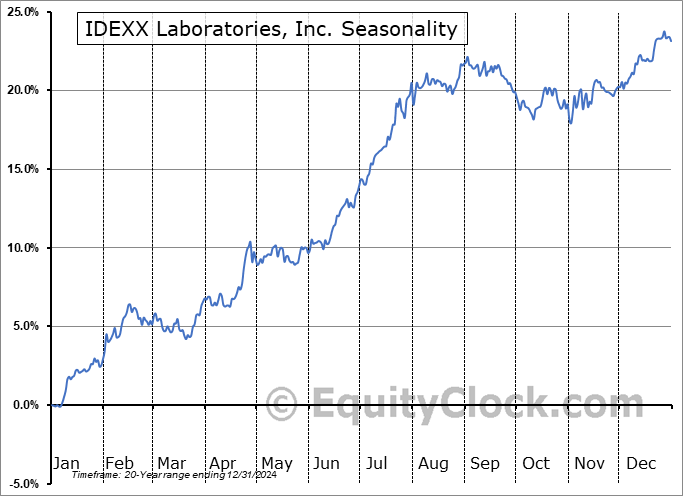
IDEXX Laboratories, Inc. (NASD:IDXX) Seasonal Chart

Artis Real Estate Investment Trust (TSE:AX/UN.TO) Seasonal Chart

Extendicare Inc. (TSE:EXE.TO) Seasonal Chart

A&W Revenue Royalties Income Fund (TSE:AW/UN.TO) Seasonal Chart

iShares Canadian Value Index ETF (TSE:XCV.TO) Seasonal Chart

SPDR MSCI EAFE Quality Mix ETF (AMEX:QEFA) Seasonal Chart
Â
Â
The Markets
Stocks slipped on Friday following the release of a weaker than expected read of payroll growth for the month of November. The Bureau of Labor Statistics indicates that 210,000 payrolls were added last month, which was less than half of the consensus analyst estimate that called for a rise of 545,000. The unemployment rate improved from 4.6% to 4.2% and average hourly earnings continue on a steep ascent, this time rising by 0.3%, which was just short of the 0.4% increase that was forecasted. Stripping out the seasonal adjustments, payrolls actually increased by 778,000, or 0.5%, in November, which is more than double the 0.2% increase that is average for this eleventh month of the year. The year-to-date change is now higher by 5.2% through the first eleven months of the year, which is twice as strong as the 2.6% increase that is average by this point. We sent out further insight to subscribers intraday, including what the results mean for our seasonal strategy. Subscribe now.

The S&P 500 shed just over eight-tenths of one percent, closing at the 50-day moving average that it has been flirting with over the past few days. If you recall, this has been our level that we have been closely scrutinizing given the direction of the intermediate trend, as gauged by the 50-day moving average, plays well to the timeline that our seasonal strategy encompasses. The fact that the benchmark managed to close at this level (albeit barely below) suggests that the hurdle remains intact, but the willingness of investors to send prices below the hurdle intraday makes it one to continue to watch. Resistance can continue to be pegged at the declining 20-day moving average, now at 4652, while short-term support is starting to become derived at 4500. While intermediate to long-term trends can continued to be deemed positive, the short-term trend is what is being questioned, as we have portrayed on the hourly chart in recent days. Momentum indicators are gradually losing their characteristics of a bullish trend, although, these are early days.

Today, in our Market Outlook to subscribers, we discuss the following:
- The tendency for the equity market in the weeks ahead and what trades we enacted going into this period
- The prudent course of action for the next couple of weeks and the break above a double-bottom pattern in bonds
- A look at the monthly payroll report and what the results mean for our seasonal portfolio
- Canadian Labour Force Survey
- Investor sentiment
Subscribe now and we’ll send this outlook to you.
Sentiment on Friday, as gauged by the put-call ratio, ended bearish at 1.15.

Â
Â
Â
Seasonal charts of companies reporting earnings today:


Â
Â
S&P 500 Index


Â
TSE Composite


| Sponsored By... |

|

