Stock Market Outlook for December 3, 2021

The trend of vehicle sales is slowly normalizing as supply-chain bottlenecks alleviate, but there is substantial progress that is required.
Â
Â
Â
*** Stocks highlighted are for information purposes only and should not be considered as advice to purchase or to sell mentioned securities.  As always, the use of technical and fundamental analysis is encouraged in order to fine tune entry and exit points to average seasonal trends.
Stocks Entering Period of Seasonal Strength Today:
Subscribers – Click on the relevant link to view the full profile. Not a subscriber? Signup here.

Cabot Oil & Gas Corp. (NYSE:COG) Seasonal Chart

Martinrea Intl Inc. (TSE:MRE.TO) Seasonal Chart

Advanced Energy Industries, Inc. (NASD:AEIS) Seasonal Chart

iShares MSCI Europe IMI Index ETF (TSE:XEU.TO) Seasonal Chart

Keg Royalties Income Fund (TSE:KEG/UN.TO) Seasonal Chart

Canfor Pulp Products Inc. (TSE:CFX.TO) Seasonal Chart

Vanguard FTSE Developed Europe All Cap Index ETF (TSE:VE.TO) Seasonal Chart

iShares Core MSCI EAFE IMI Index ETF (TSE:XEF.TO) Seasonal Chart

iShares MSCI EAFE Index ETF (CAD-Hedged) (TSE:XIN.TO) Seasonal Chart

BMO International Dividend ETF (TSE:ZDI.TO) Seasonal Chart

Western Forest Products Inc. (TSE:WFG.TO) Seasonal Chart

BMO MSCI EAFE Index ETF (TSE:ZEA.TO) Seasonal Chart
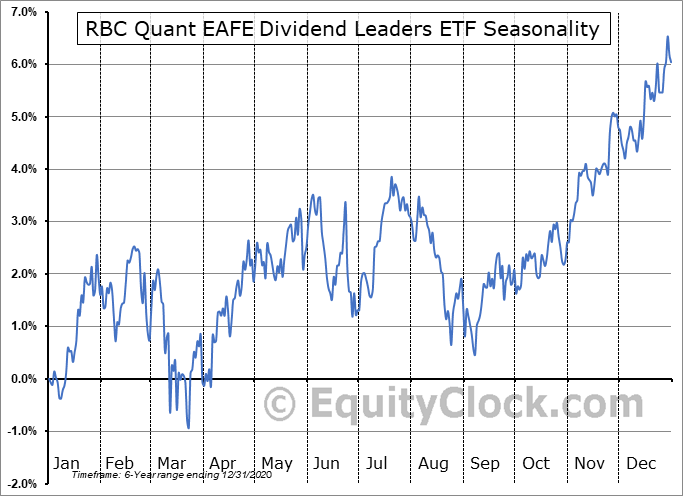
RBC Quant EAFE Dividend Leaders ETF (TSE:RID.TO) Seasonal Chart

Vanguard FTSE Developed All Cap ex U.S. Index ETF (TSE:VDU.TO) Seasonal Chart

ARK Autonomous Technology & Robotics ETF (AMEX:ARKQ) Seasonal Chart

iShares MSCI Netherlands ETF (NYSE:EWN) Seasonal Chart
Â
Â
Â
The Markets
Stocks rebounded on Thursday as the volatility surrounding the news of the Omicron variant keeps investors on edge. The S&P 500 Index jumped by 1.42%, retaking levels above the 50-day moving average that was broken in the previous session. Resistance can continue to be pegged at the declining 20-day moving average, now at 4660. The market remains in a tenuous situation going into the release of the monthly payroll report and ahead of the average tax-loss selling period that commences next week.

Today, in our Market Outlook to subscribers, we discuss the following:
- An hourly look at the large-cap benchmark and the limits to the short-term trend
- Weekly Jobless Claims, the health of the labor market, and what to expect from November’s Non-Farm Payroll report
- Natural gas
- US Vehicle Sales and Auto stocks
- Investor sentiment
Subscribe now and we’ll send this outlook to you.
Sentiment on Thursday, as gauged by the put-call ratio, ended bearish at 1.08.Â

Â
Seasonal charts of companies reporting earnings today:


Â
Â
S&P 500 Index


Â
Â
TSE Composite


| Sponsored By... |

|

