Stock Market Outlook for December 1, 2021

December is another seasonally strong month with the S&P 500 Index rising by 0.7%, on average, with 70% of periods showing positive results.
Â
Â
Â
*** Stocks highlighted are for information purposes only and should not be considered as advice to purchase or to sell mentioned securities.  As always, the use of technical and fundamental analysis is encouraged in order to fine tune entry and exit points to average seasonal trends.
Stocks Entering Period of Seasonal Strength Today:
Subscribers – Click on the relevant link to view the full profile. Not a subscriber? Signup here.

Patterson-UTI Energy, Inc. (NASD:PTEN) Seasonal Chart

Valero Energy Corp (NYSE:VLO) Seasonal Chart

FLIR Systems, Inc. (NASD:FLIR) Seasonal Chart
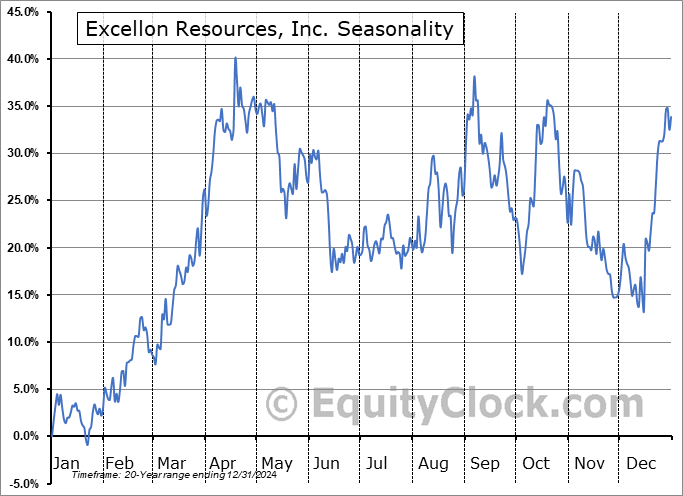
Excellon Resources, Inc. (TSE:EXN.TO) Seasonal Chart

Smart Real Estate Investment Trust (TSE:SRU/UN.TO) Seasonal Chart

Cognex Corp. (NASD:CGNX) Seasonal Chart

Helen of Troy Ltd. (NASD:HELE) Seasonal Chart

Invesco S&P International Developed Low Volatility Index ETF (TSE:ILV.TO) Seasonal Chart

iShares 1-10 Year Laddered Government Bond Index ETF (TSE:CLG.TO) Seasonal Chart

Purpose Multi-Strategy Market Neutral Fund (TSE:PMM.TO) Seasonal Chart
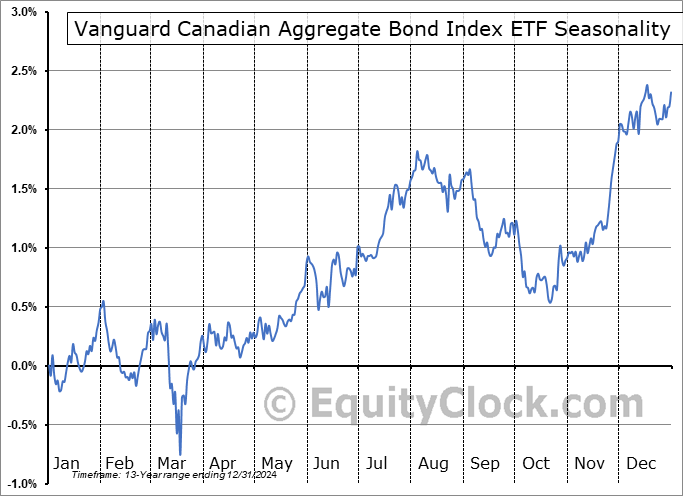
Vanguard Canadian Aggregate Bond Index ETF (TSE:VAB.TO) Seasonal Chart
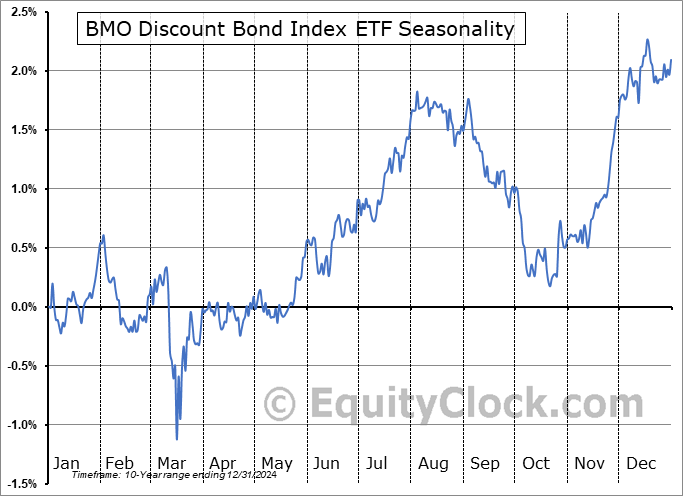
BMO Discount Bond Index ETF (TSE:ZDB.TO) Seasonal Chart

iShares MSCI Brazil Capped ETF (NYSE:EWZ) Seasonal Chart

iShares Cohen & Steers REIT ETF (NYSE:ICF) Seasonal Chart

iShares Interest Rate Hedged Corporate Bond ETF (AMEX:LQDH) Seasonal Chart

Invesco Cleantech ETF (NYSE:PZD) Seasonal Chart

Global X SuperDividend Emerging Markets ETF (AMEX:SDEM) Seasonal Chart
Â
Â
The Markets
Stocks closed sharply lower on Tuesday as concerns pertaining to the spread of COVID and new revelations pertaining to the Fed taper timeline had investors adjusting their risk exposure. The S&P 500 Index shed 1.90%, falling from short-term resistance that was tested on Monday around the 20-day moving average. The benchmark is now reaching back to levels around the 50-day moving average. Volume was much higher than average in the Tuesday session, hinting of a capitulation event around this intermediate hurdle. We will be watching for signs of support around this hurdle in the days ahead as we enter the seasonally strong month of December.

Today, in our Market Outlook to subscribers, we discuss the following:
- Breakdowns are starting to stack up
- The chart that we think looks particularly threatening
- Monthly look at the S&P 500 Index and the seasonal tendencies for December
- Case-Shiller Home Price Index
- Canada GDP and what is driving the activity in this country
Subscribe now and we’ll send this outlook to you.
For the month of December, gains are the norm for stocks with the S&P 500 Index rising by an average of 0.7% in the final month of the year over the past two decades. Positive results have been realized in 70% of Decembers. Returns have range from a loss of 9.2% in December of 2018 to a gain of 6.5% in December of 2010. The final month of the year is often associated with the Santa Claus rally, which provides a good mix of strength in core-cyclical (energy, financials) and defensive (utilities, REITs) bets. Technology has historically been the weakest sector in this final stretch of the year. We provide further insight to subscribers in our just released Monthly Outlook for December. Look for this report in your inbox.


Just released…
Our monthly report for December is out, providing everything that you need to know for the month(s) ahead.
Highlights in this report include:
- Equity market tendencies in the month of December
- Tracking the spread of COVID
- REITs
- Previous resistance as support
- Small Caps
- Financial Loan Activity
- Copper
- Manufacturer Sentiment
- Hints that supply-chain bottlenecks are alleviating
- Treasury Bonds
- Real return of bonds
- Mid-term election year tendency for stocks
- Dazed and confused by pot stocks
- The technical status of the S&P 500 Index
- Examining gauges of market breadth
- Time to rotate to Canadian equities?
- Gold
- US Dollar
- Positioning for the months ahead
- Sector reviews and ratings
- Stocks that have frequently gained in the month of December
- Notable stocks and ETFs entering their period of strength in December
Subscribe now and we’ll send this outlook to you.
Sentiment on Tuesday, as gauged by the put-call ratio, ended close to neutral at 0.94.

Â
Â
Seasonal charts of companies reporting earnings today:


Â
Â
S&P 500 Index


Â
Â
TSE Composite


| Sponsored By... |

|

