Stock Market Outlook for November 30, 2021

Defensive sectors receiving much of the benefit of the Omicron rebound, hinting that concerns pertaining to the spread of the virus persist.
Â
Â
Â
*** Stocks highlighted are for information purposes only and should not be considered as advice to purchase or to sell mentioned securities.  As always, the use of technical and fundamental analysis is encouraged in order to fine tune entry and exit points to average seasonal trends.
Stocks Entering Period of Seasonal Strength Today:
Subscribers – Click on the relevant link to view the full profile. Not a subscriber? Signup here.

First Asset 1-5 Year Laddered Government Strip Bond Index ETF (TSE:BXF.TO) Seasonal Chart

Alphabet Inc. – Class C (NASD:GOOG) Seasonal Chart

Micron Technology, Inc. (NASD:MU) Seasonal Chart

Atco Ltd. (TSE:ACO/X.TO) Seasonal Chart

Western Digital Corp. (NASD:WDC) Seasonal Chart

Interfor Corp. (TSE:IFP.TO) Seasonal Chart

Saputo Group, Inc. (TSE:SAP.TO) Seasonal Chart

Applied Materials, Inc. (NASD:AMAT) Seasonal Chart
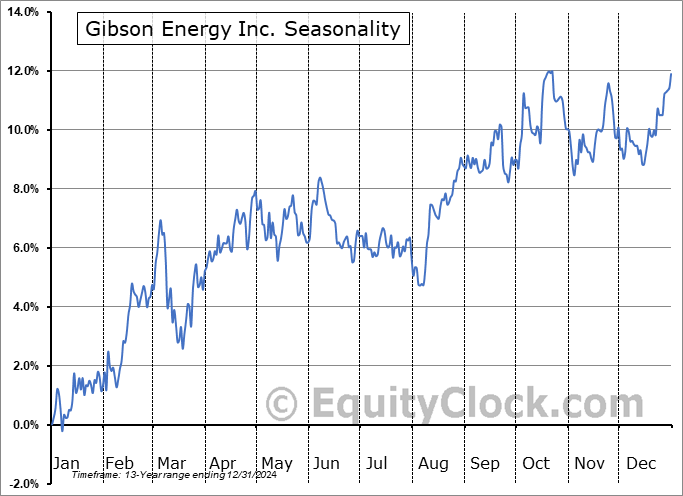
Gibson Energy Inc. (TSE:GEI.TO) Seasonal Chart

Vanguard Total International Bond ETF (NASD:BNDX) Seasonal Chart

WisdomTree Europe SmallCap Dividend Fund (NYSE:DFE) Seasonal Chart

iShares MSCI Frontier 100 ETF (AMEX:FM) Seasonal Chart

VanEck Vectors Uranium+Nuclear Energy ETF (NYSE:NLR) Seasonal Chart

iShares MSCI Global Metals & Mining Producers ETF (AMEX:PICK) Seasonal Chart
Â
Â
The Markets
Stocks snapped back from Friday’s selloff as investors contend that the bark is greater than the bite for the new COVID variant of concern. The S&P 500 Index gained 1.32%, reaching back to what is now short-term resistance around the 20-day moving at 4672. Downside risks remain to intermediate support around the 50-day moving average at 4531. Momentum indicators continue to lean negative following the rollover from overbought levels seen early in November, however, they also continue to show characteristics of a bullish trend. The snap-back during the session is welcome, but it should be noted that we are not out of the woods, yet. Strength in the market is the norm into the start of December, but once we move beyond the first Friday of the month, the tax-loss selling period typically imposes a burden on the broader market through the middle of the month. We listed everything that we are looking at and how to play this recent jitter in stocks in our Omicron Strategy Session report that was released on Friday. Subscribers can access this report in our report archive, once logged in.

Today, in our Market Outlook to subscribers, we discuss the following:
- Defensive sectors showing renewed buying demand
- Notable changes in this week’s chart books, including a downgrade of a much beloved market segment
Subscribe now and we’ll send this outlook to you.
Want to know which areas of the market to buy or sell? Our Weekly Chart Books have just been updated, providing a clear Accumulate, Avoid, or Neutral rating for currencies, cryptocurrencies, commodities, broad markets, and subsectors/industries of the market. Subscribers can login and click on the relevant links to access.
Subscribe now.
Sentiment on Monday, as gauged by the put-call ratio, ended bullish at 0.84.

Â
Â
Â
Seasonal charts of companies reporting earnings today:

 Seasonal Chart")


Â
Â
S&P 500 Index


Â
Â
TSE Composite


| Sponsored By... |

|

