Stock Market Outlook for November 24, 2021

As the financial sector bounces from levels of previous resistance, now support, we are seeing encouraging data on loan growth for October.
Â
Â
Â
*** Stocks highlighted are for information purposes only and should not be considered as advice to purchase or to sell mentioned securities.  As always, the use of technical and fundamental analysis is encouraged in order to fine tune entry and exit points to average seasonal trends.
Stocks Entering Period of Seasonal Strength Today:
Subscribers – Click on the relevant link to view the full profile. Not a subscriber? Signup here.

Zimmer Biomet Holdings, Inc. (NYSE:ZBH) Seasonal Chart

Exelon Corp. (NASD:EXC) Seasonal Chart

PPG Industries, Inc. (NYSE:PPG) Seasonal Chart

Trican Well Service Ltd. (TSE:TCW.TO) Seasonal Chart

Synovus Financial Corp. (NYSE:SNV) Seasonal Chart

Public Service Enterprise (NYSE:PEG) Seasonal Chart
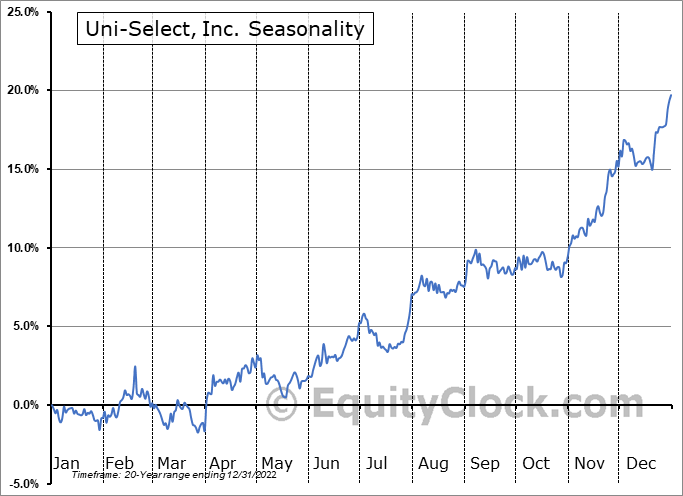
Uni-Select, Inc. (TSE:UNS.TO) Seasonal Chart

Honda Motor Co. Ltd. (NYSE:HMC) Seasonal Chart

Bausch Health Cos. Inc. (NYSE:BHC) Seasonal Chart

Schwab U.S. REIT ETF (NYSE:SCHH) Seasonal Chart
Â
Â
The Markets
Stocks closed mildly higher on Tuesday as the rotation into value segments of the market helped to offset weakness in the formerly loved growth (technology) bets. The S&P 500 index added just less than two-tenths of one percent after testing short-term support at the rising 20-day moving average at the lows of the session. The short-term variable hurdle also aligns with previously broken rising trendline support that was violated in the month of September. Intermediate support at the rising 50-day moving average presents the near-term downside risk as the market battles with short-term resistance at 4700. Intermediate and long-term trends to this market remain positive and it would be pure speculation at this point to suggest when this might end.

Today, in our Market Outlook to subscribers, we discuss the following:
- A review of indications of breadth in the market amidst the downfall in the Technology sector
- The optimal holding period for the S&P 500 Equal Weight ETF (RSP)
- Financial sector ETFs seeing previous resistance as support
- Commercial bank loan activity
Subscribe now and we’ll send this outlook to you.
Sentiment on Tuesday, as gauged by the put-call ratio, ended bullish at 0.84.

Â
Â
Â
Seasonal charts of companies reporting earnings today:


Â
Â
S&P 500 Index


Â
Â
TSE Composite


| Sponsored By... |

|

